
The staff of the Faculty Association are constantly reviewing reports and data related to the academic staff at the University of Calgary. We provide a statistical summary of sessional academic staff as part of the Fair Employment Week edition of the newsletter, and we thought we would do a similar summary for ongoing academic staff (Continuing, Contingent Term, Limited Term) and highlight some changes over the past few years. When considering changes over time, we have limited this to changes since Dr. Ed McCauley became the President of the University in January 2019 (2018-2019). The data on academic staff that were used to make this summary come from the “Datamart” which is information that is provided to the Faculty Association as part of the Collective Agreement. There are always academic staff coming and going from the University of Calgary, and we use snapshots of data at the end of March, when we have found the reports to be most stable. The data related to student enrolment included in this summary come from the Factbook from the Office of Institutional Analysis (OIA; https://www.ucalgary.ca/provost/oia/fact-book). The Factbook uses student enrolment and staff counts for the Fall of any given year.
None of the statistics or figures below include the Faculty of Nursing in Qatar.
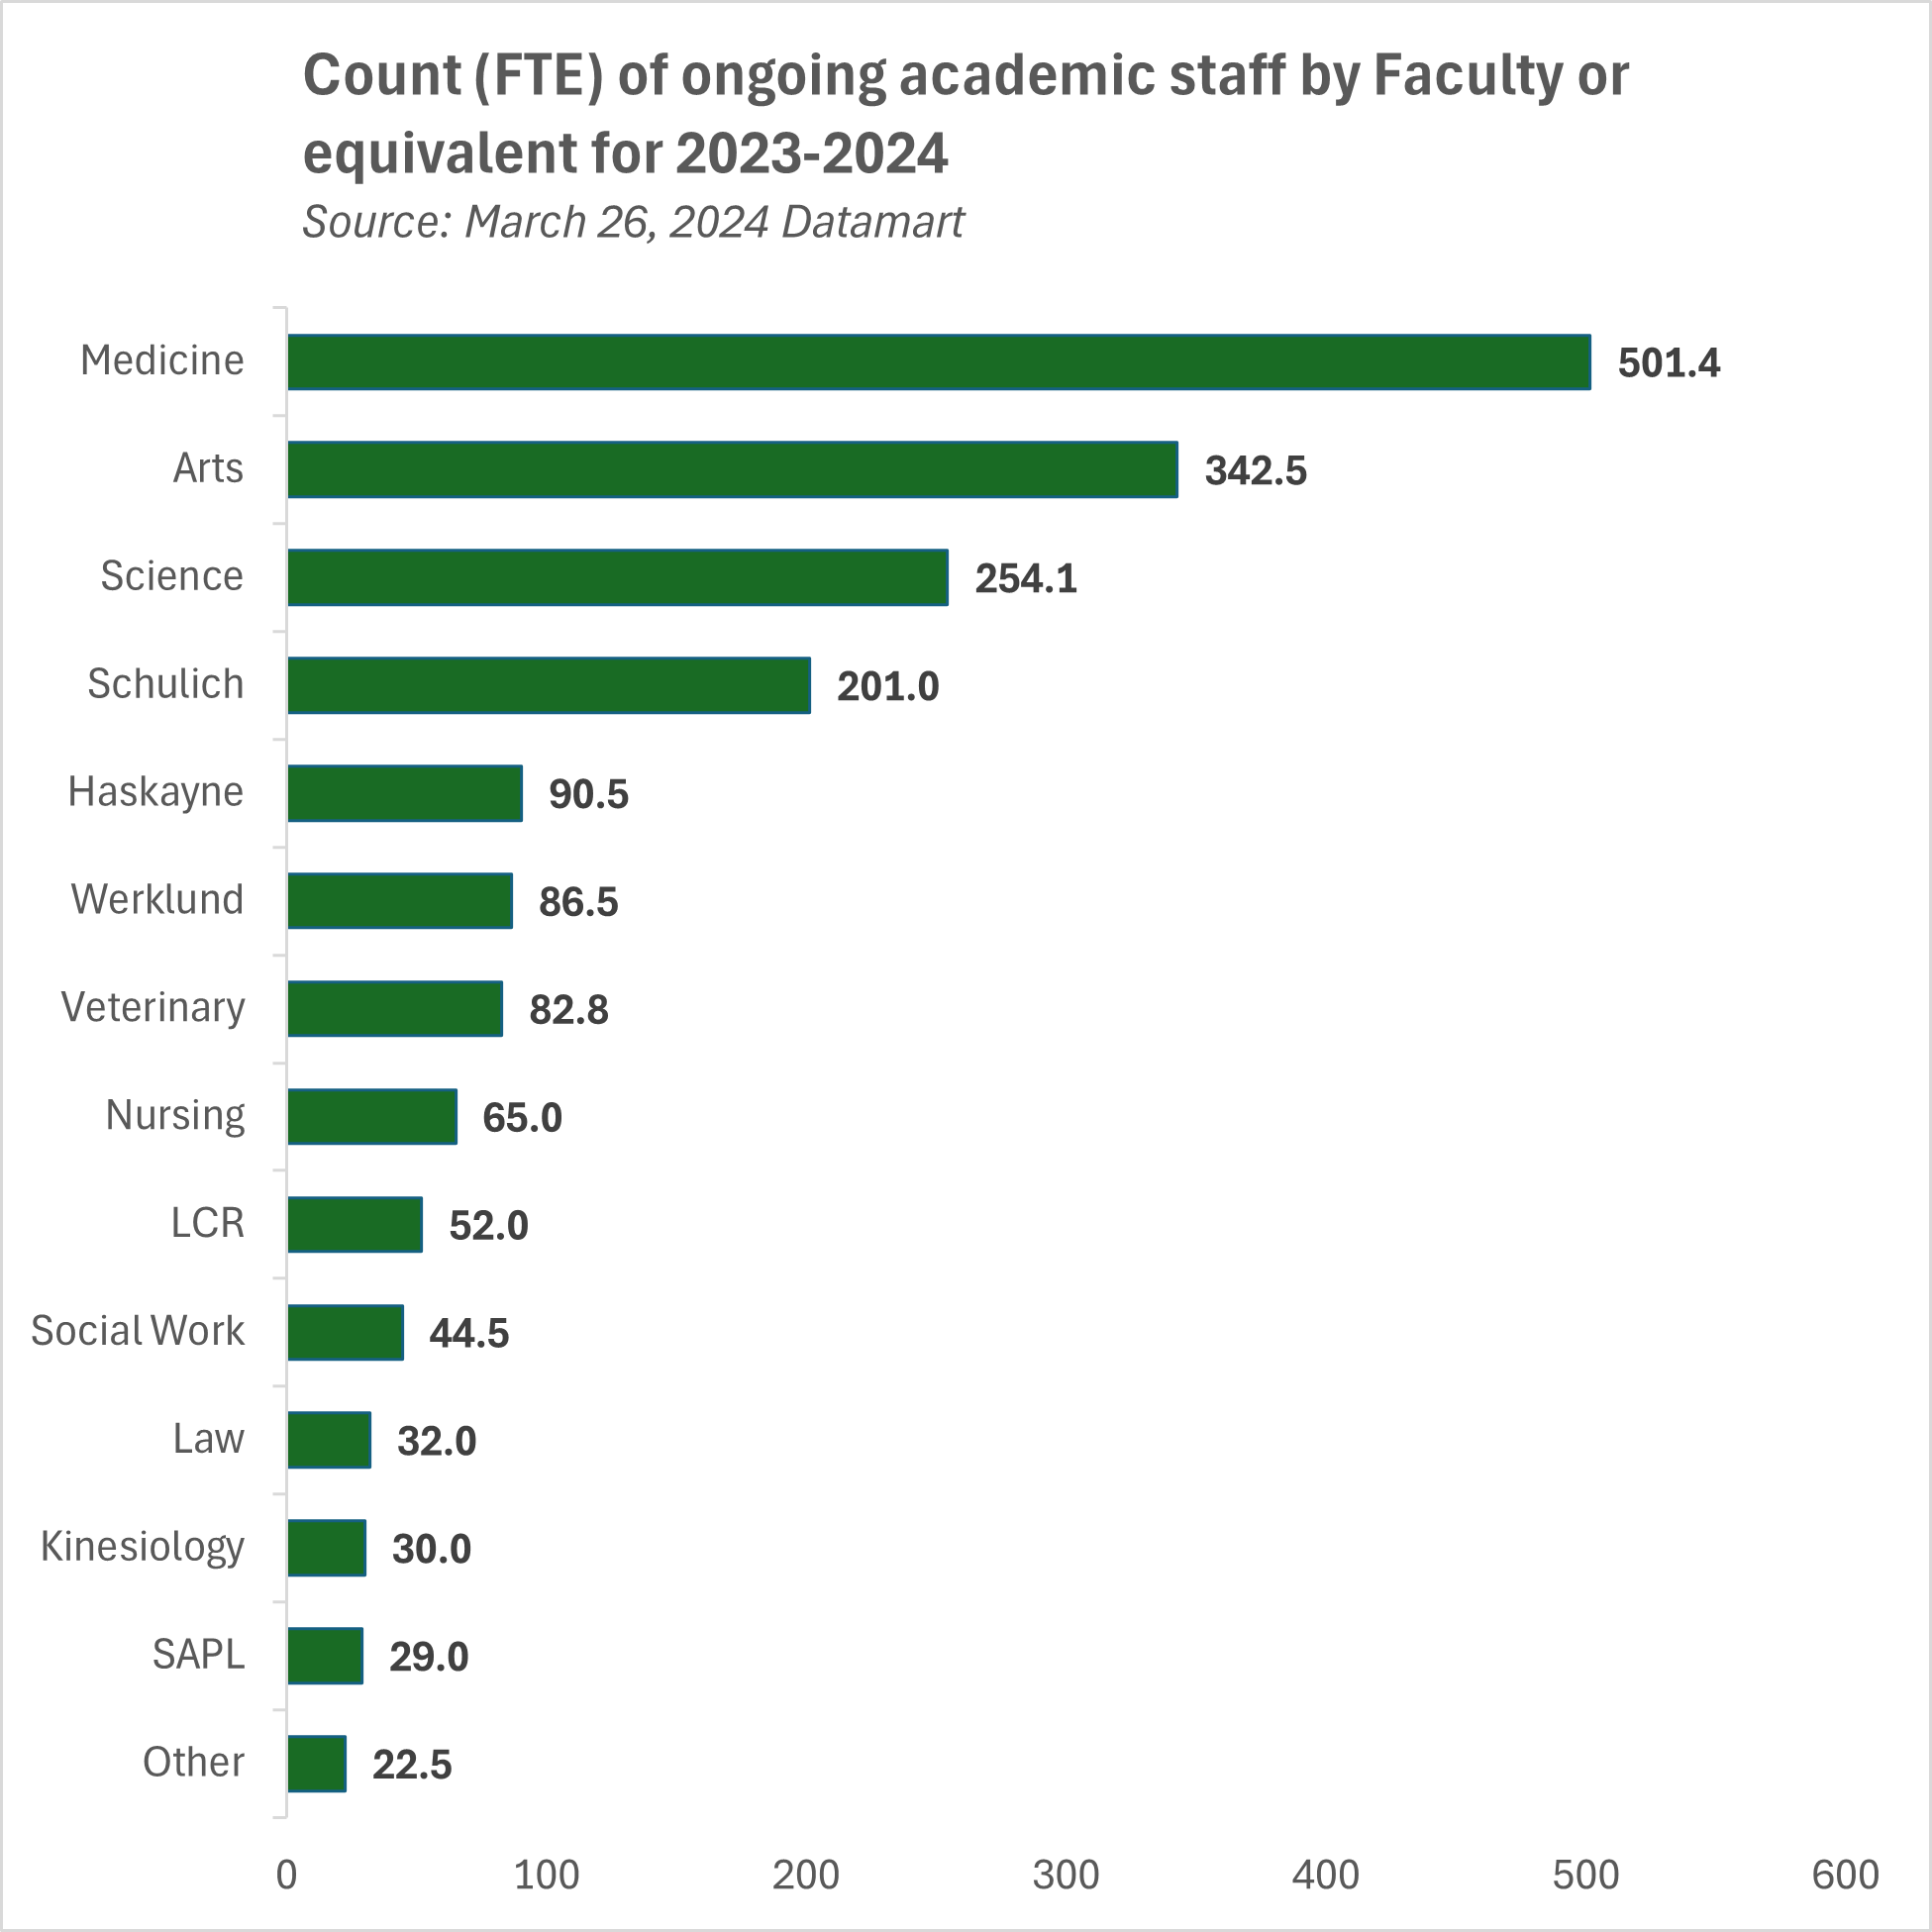
Number of ongoing academic staff
As of March 26, 2024, there were 1,843 ongoing academic staff in the Association with a full-time equivalent (FTE) of 1,833.8. Ongoing academic staff excludes sessional appointments. The Cumming School of Medicine is the largest Faculty with more than 500 ongoing academic staff members.
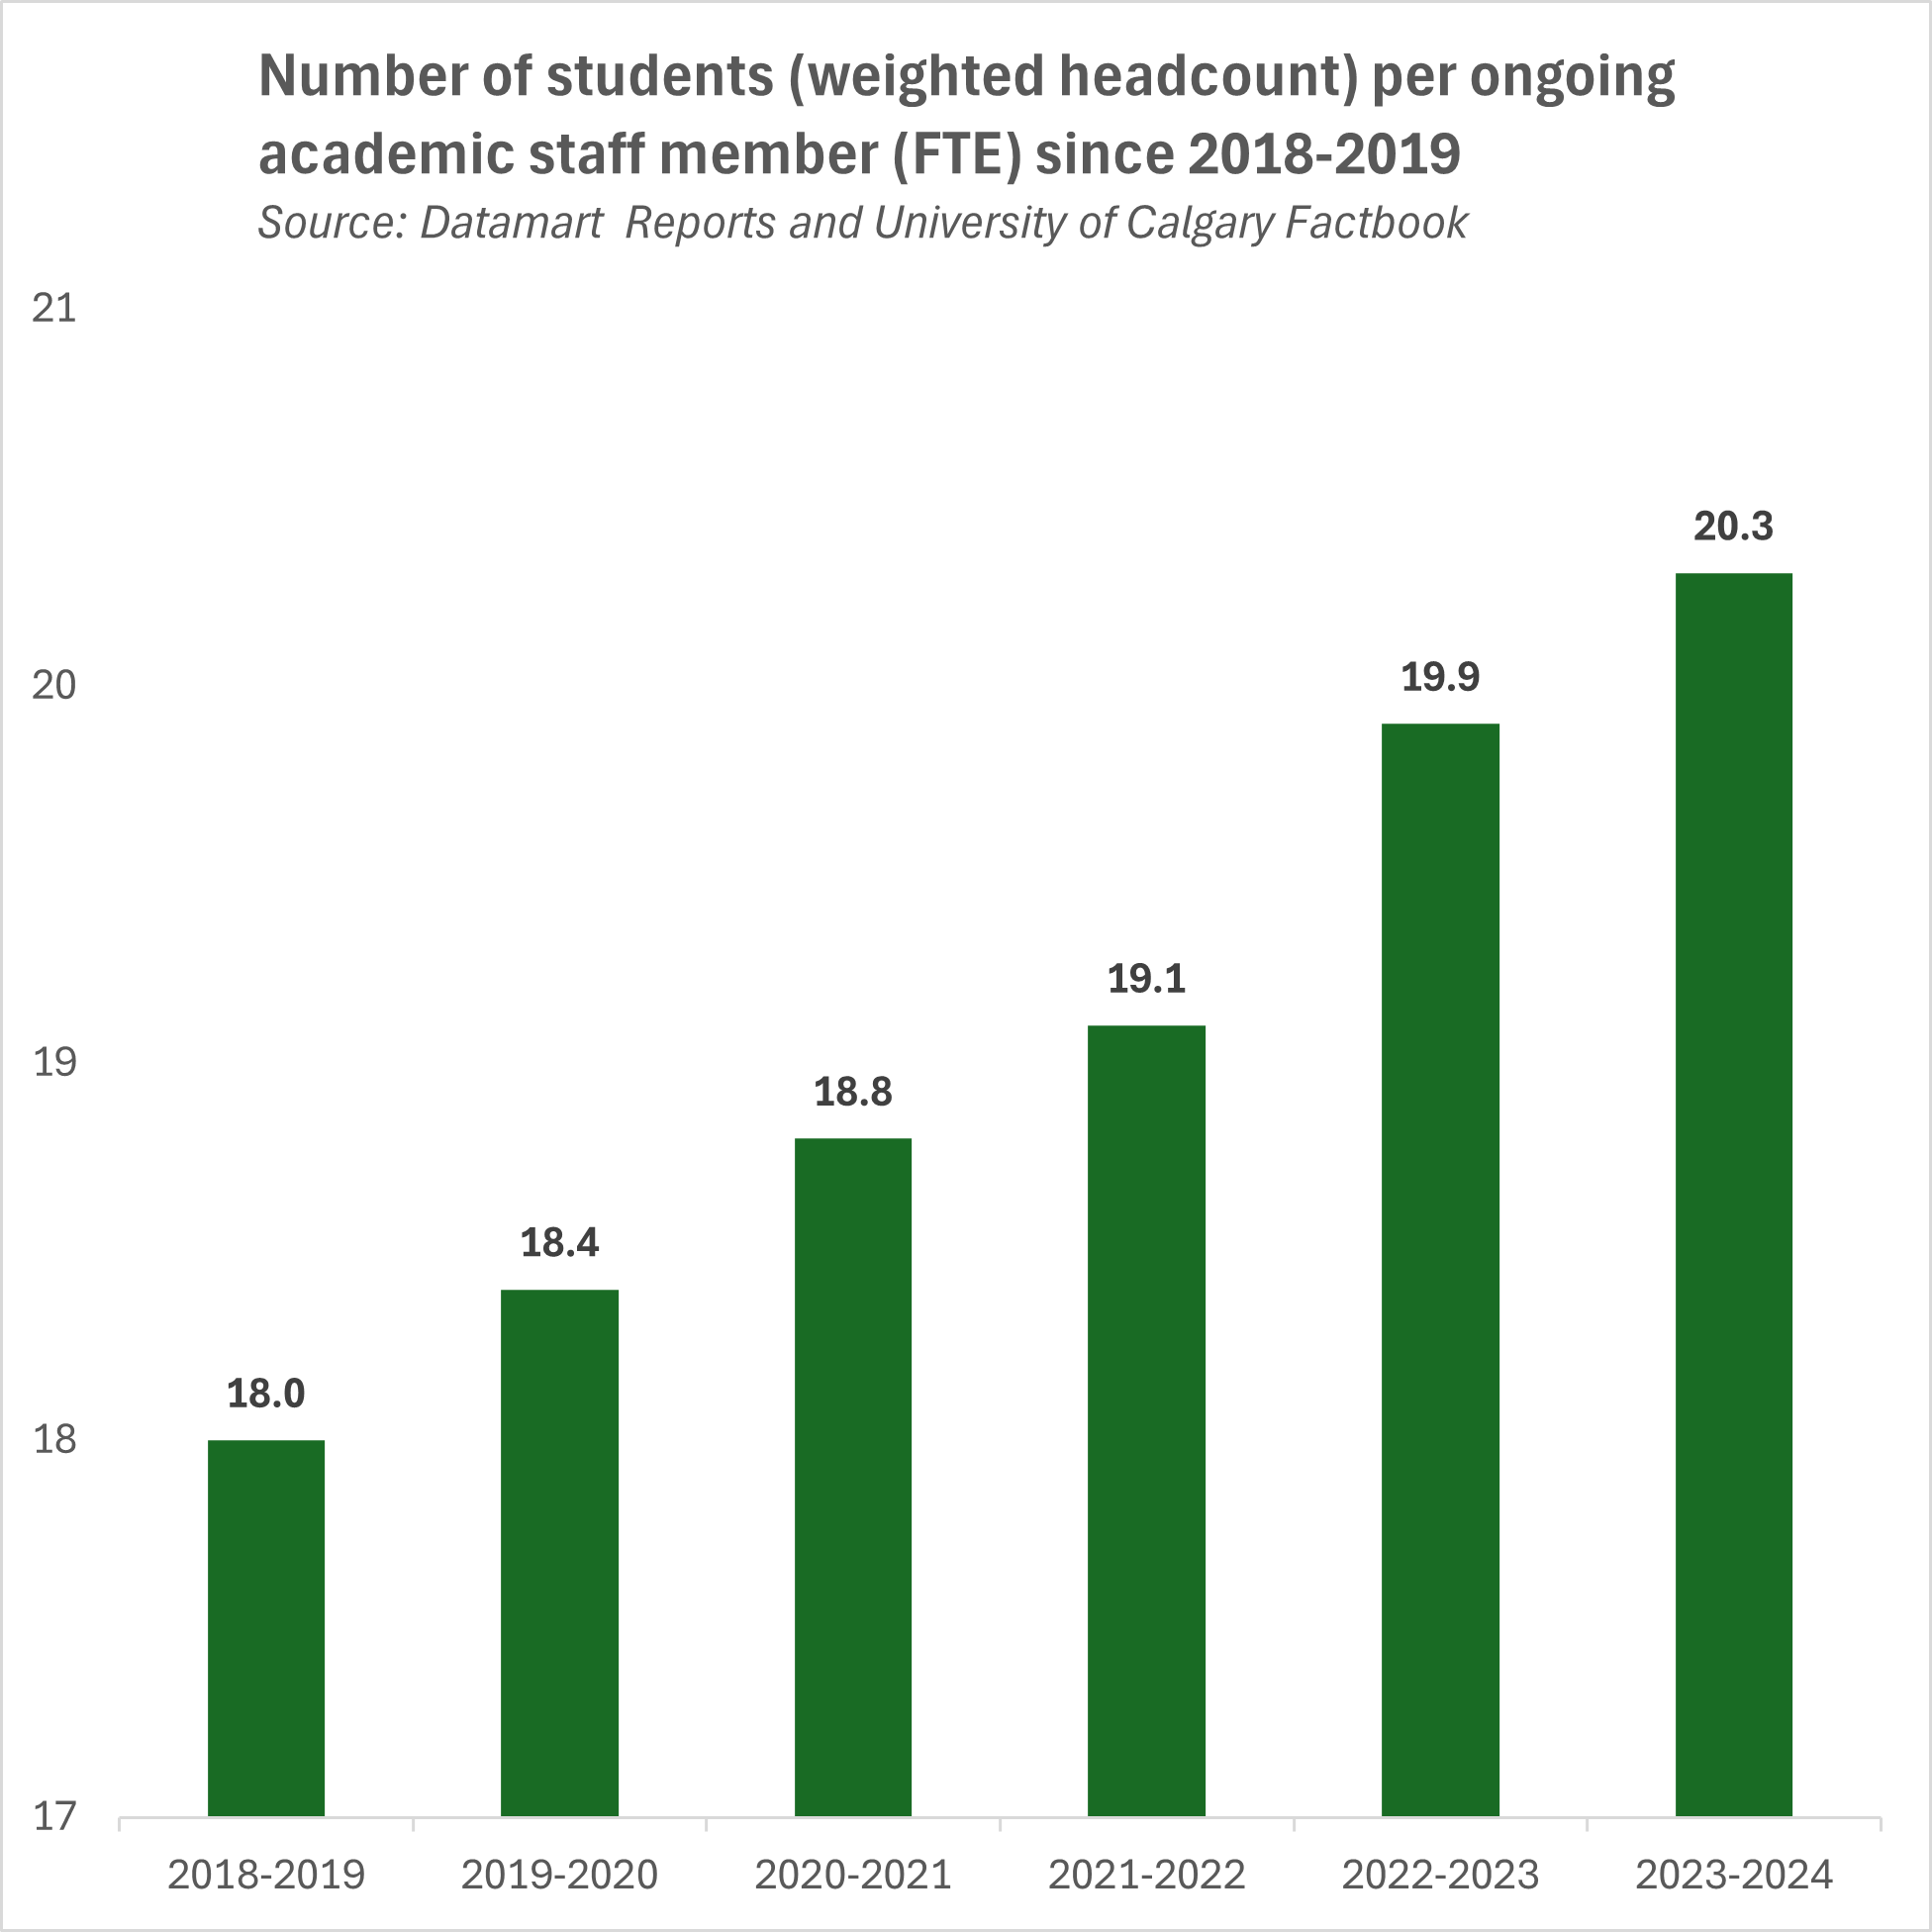
The total number of ongoing academic staff at the University of Calgary is currently about 0.3 per cent lower than it was in 2018-2019 (1,838.5) while the total student enrolment has risen steadily by about 12 per cent from 33,089 to 37,211. The effect of increasing enrolment without increasing academic staff can be seen in the ratio of students to ongoing academic staff which has risen from 18 students per ongoing academic staff member in 2018-2019 to 20 students per ongoing academic staff member in 2023-2024.
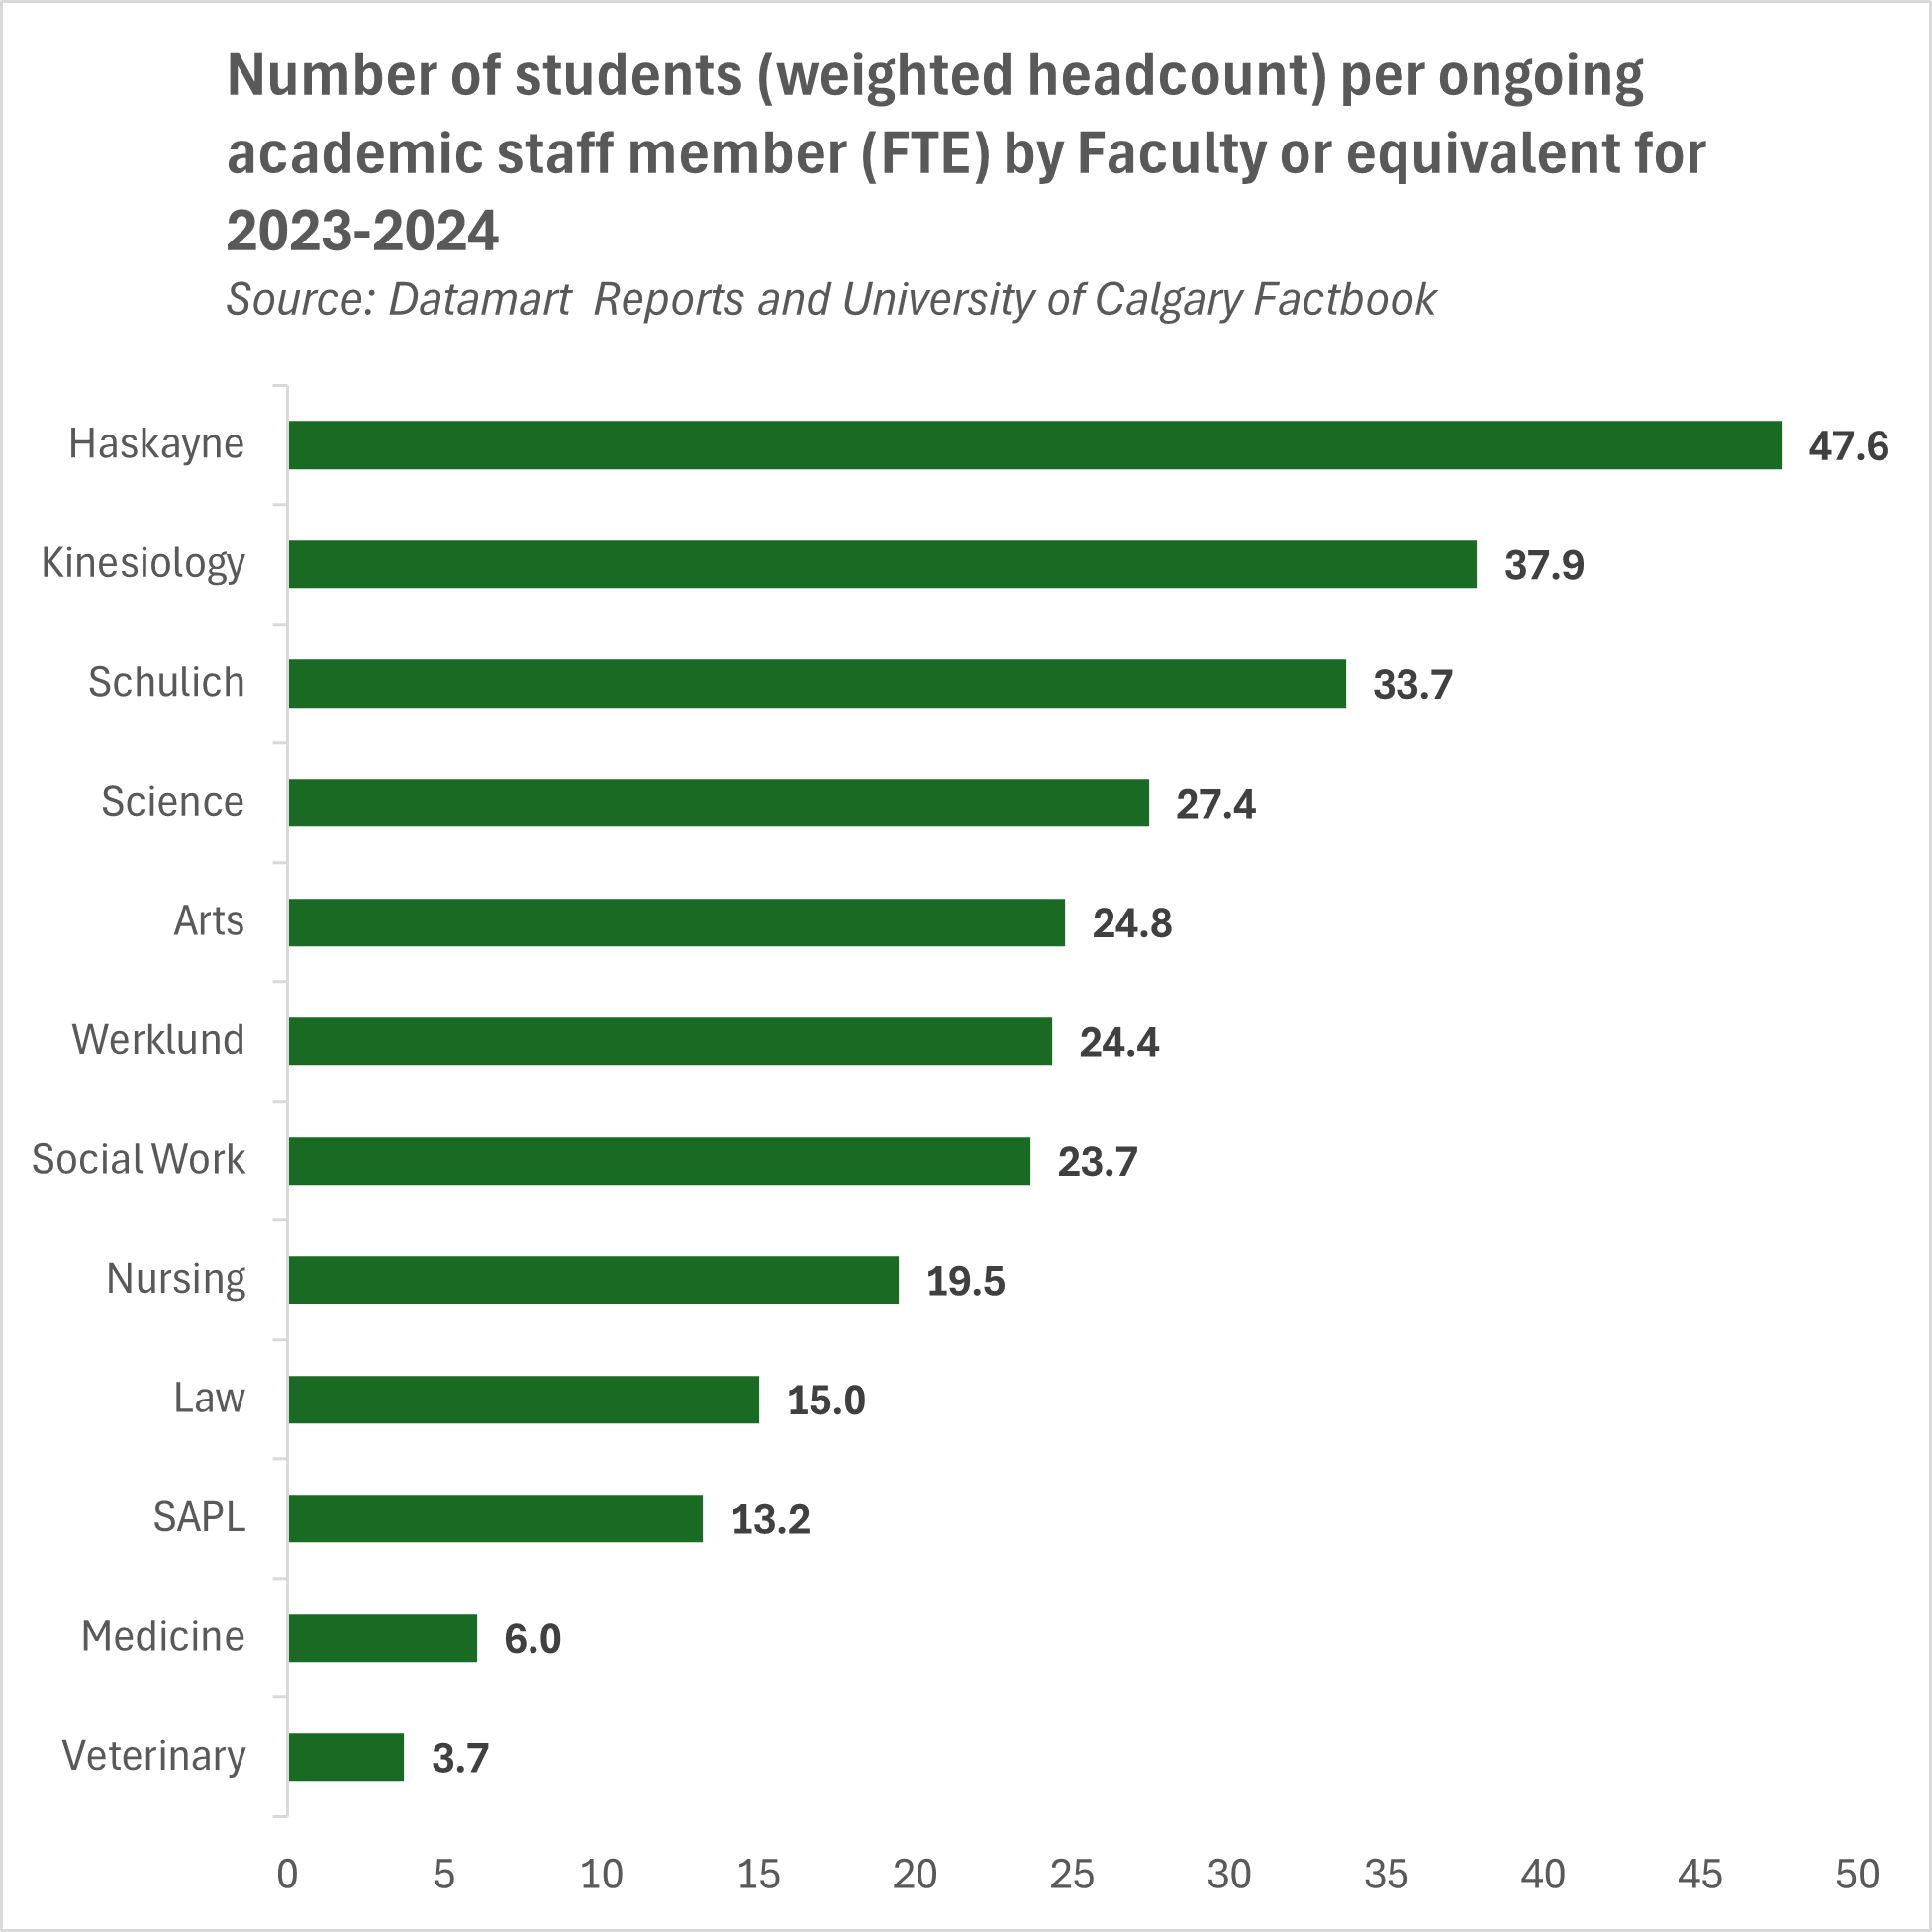
The student ratio varies among Faculties from 3.7 students per ongoing academic staff member in the Faculty of Veterinary Medicine to 47.6 students per academic staff member in the Haskayne School of Business.
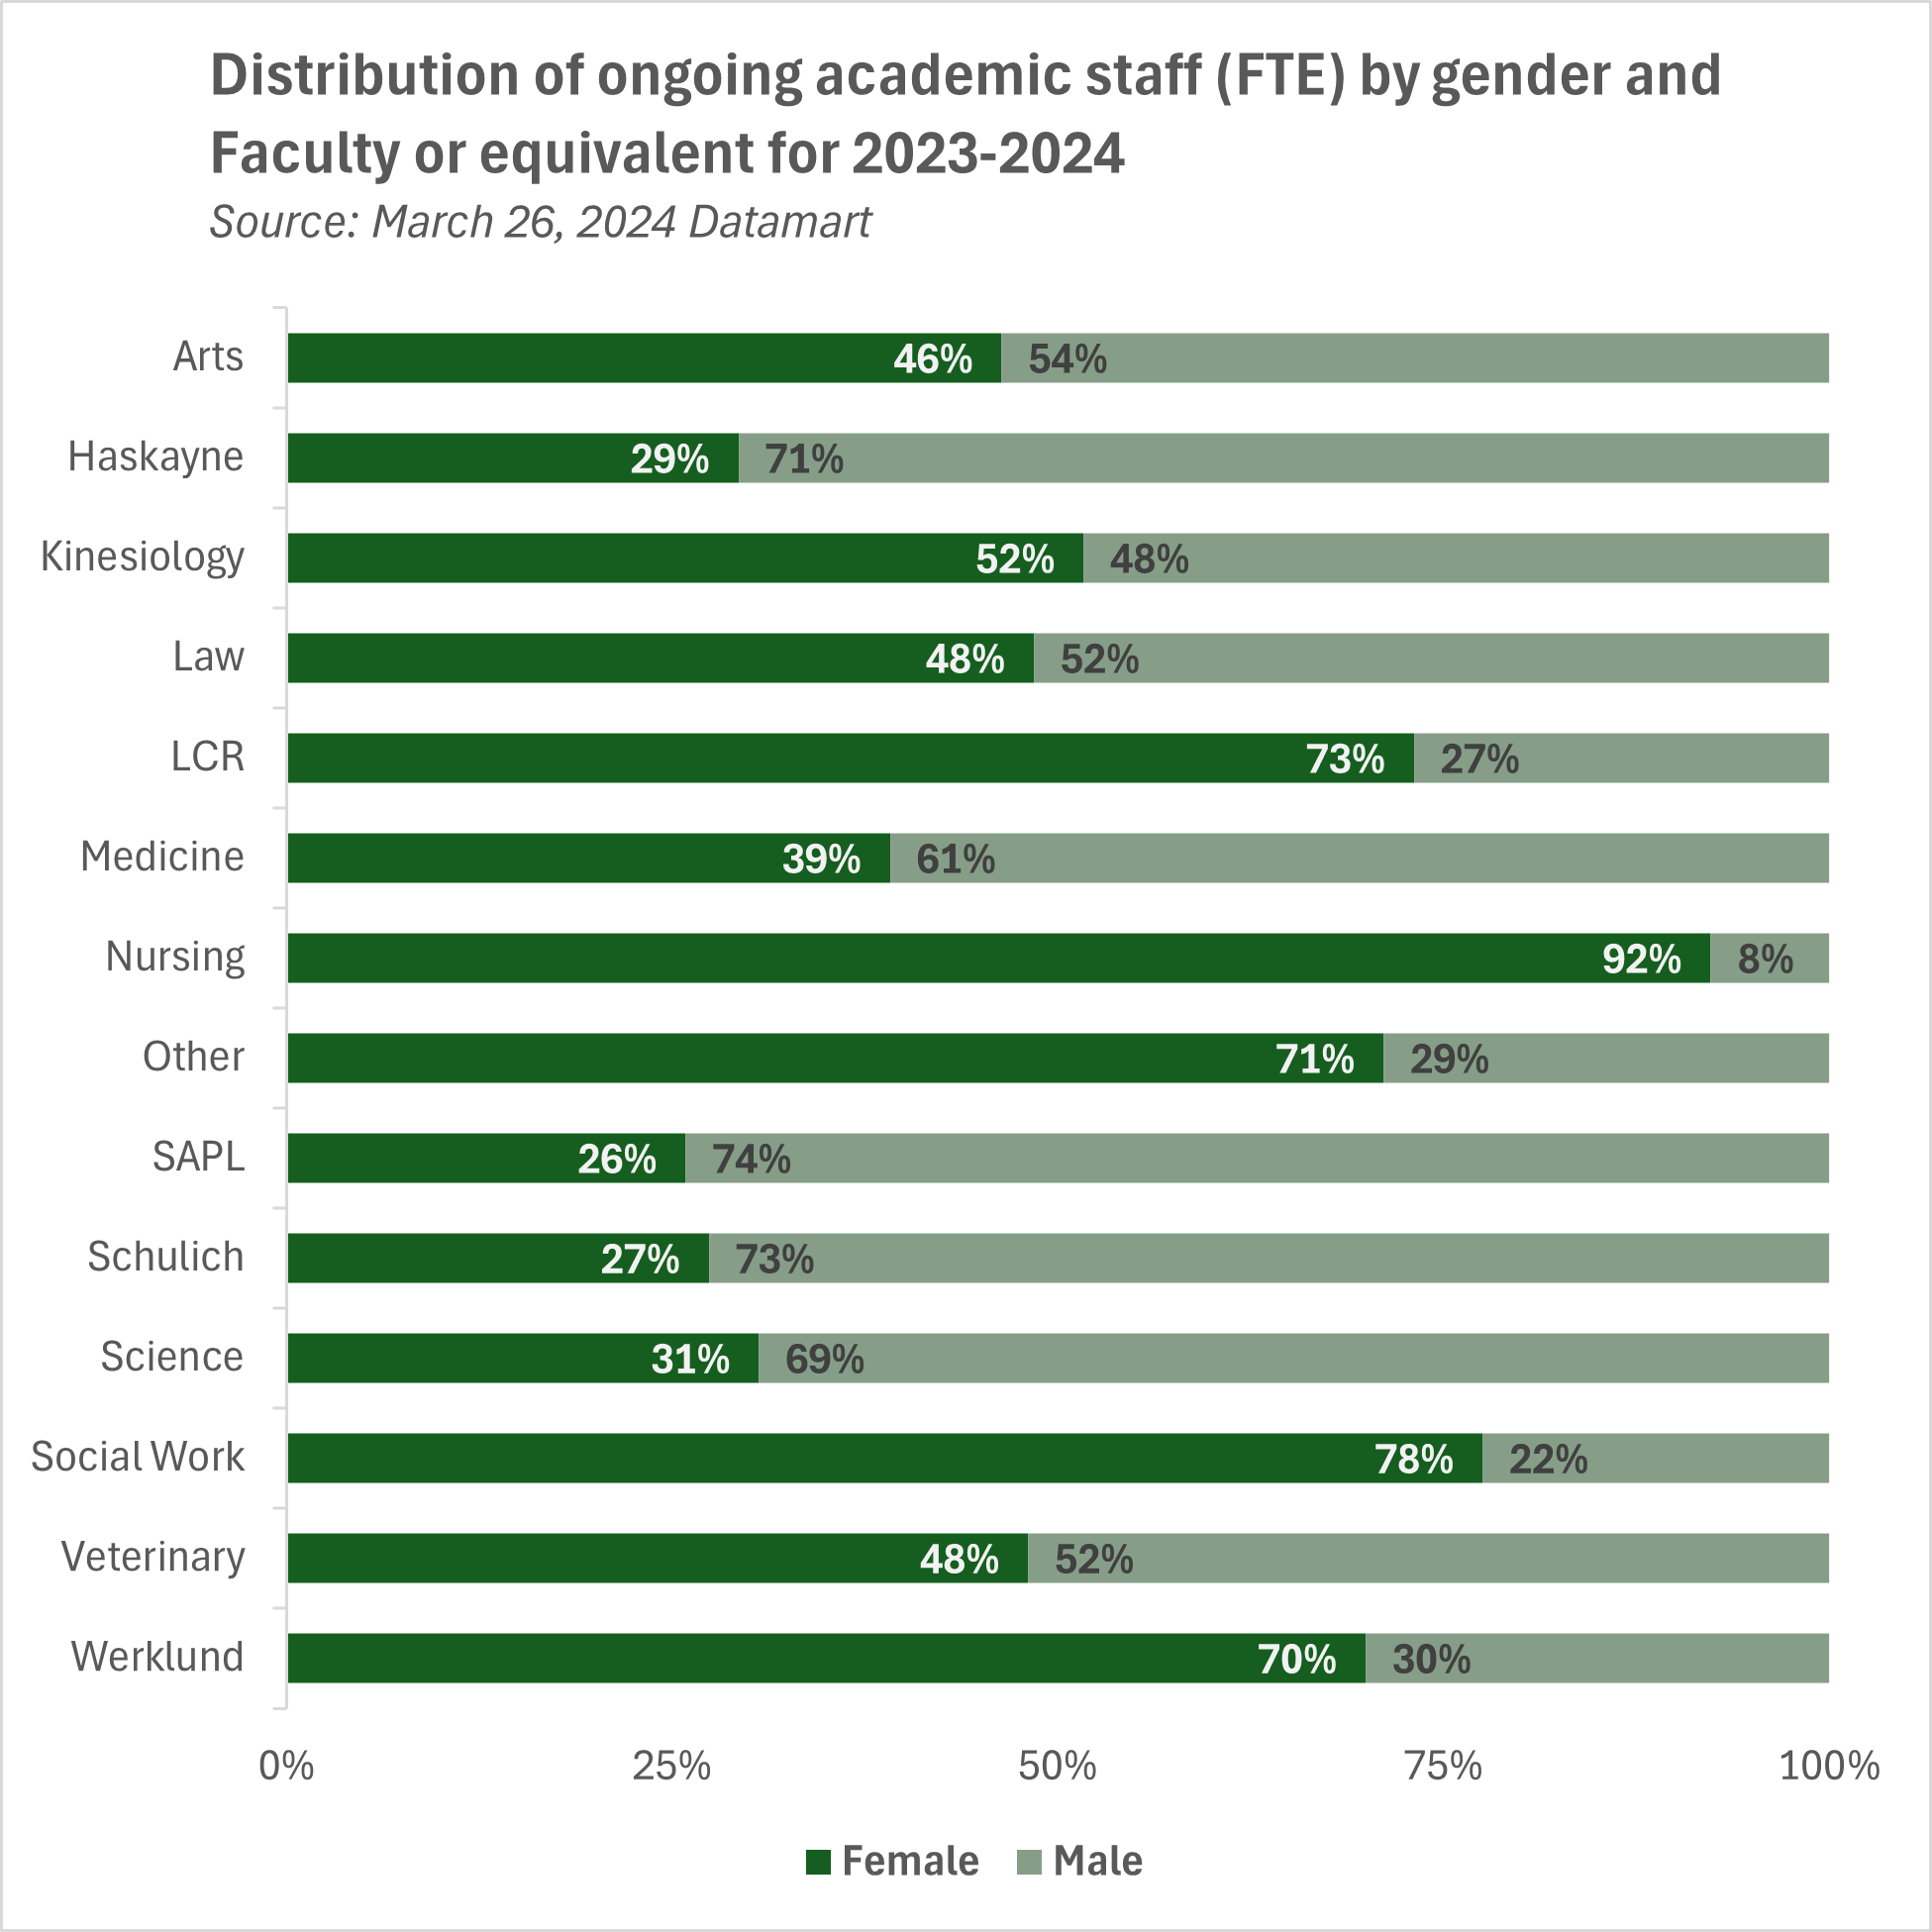
Comparison of ongoing academic staff by gender
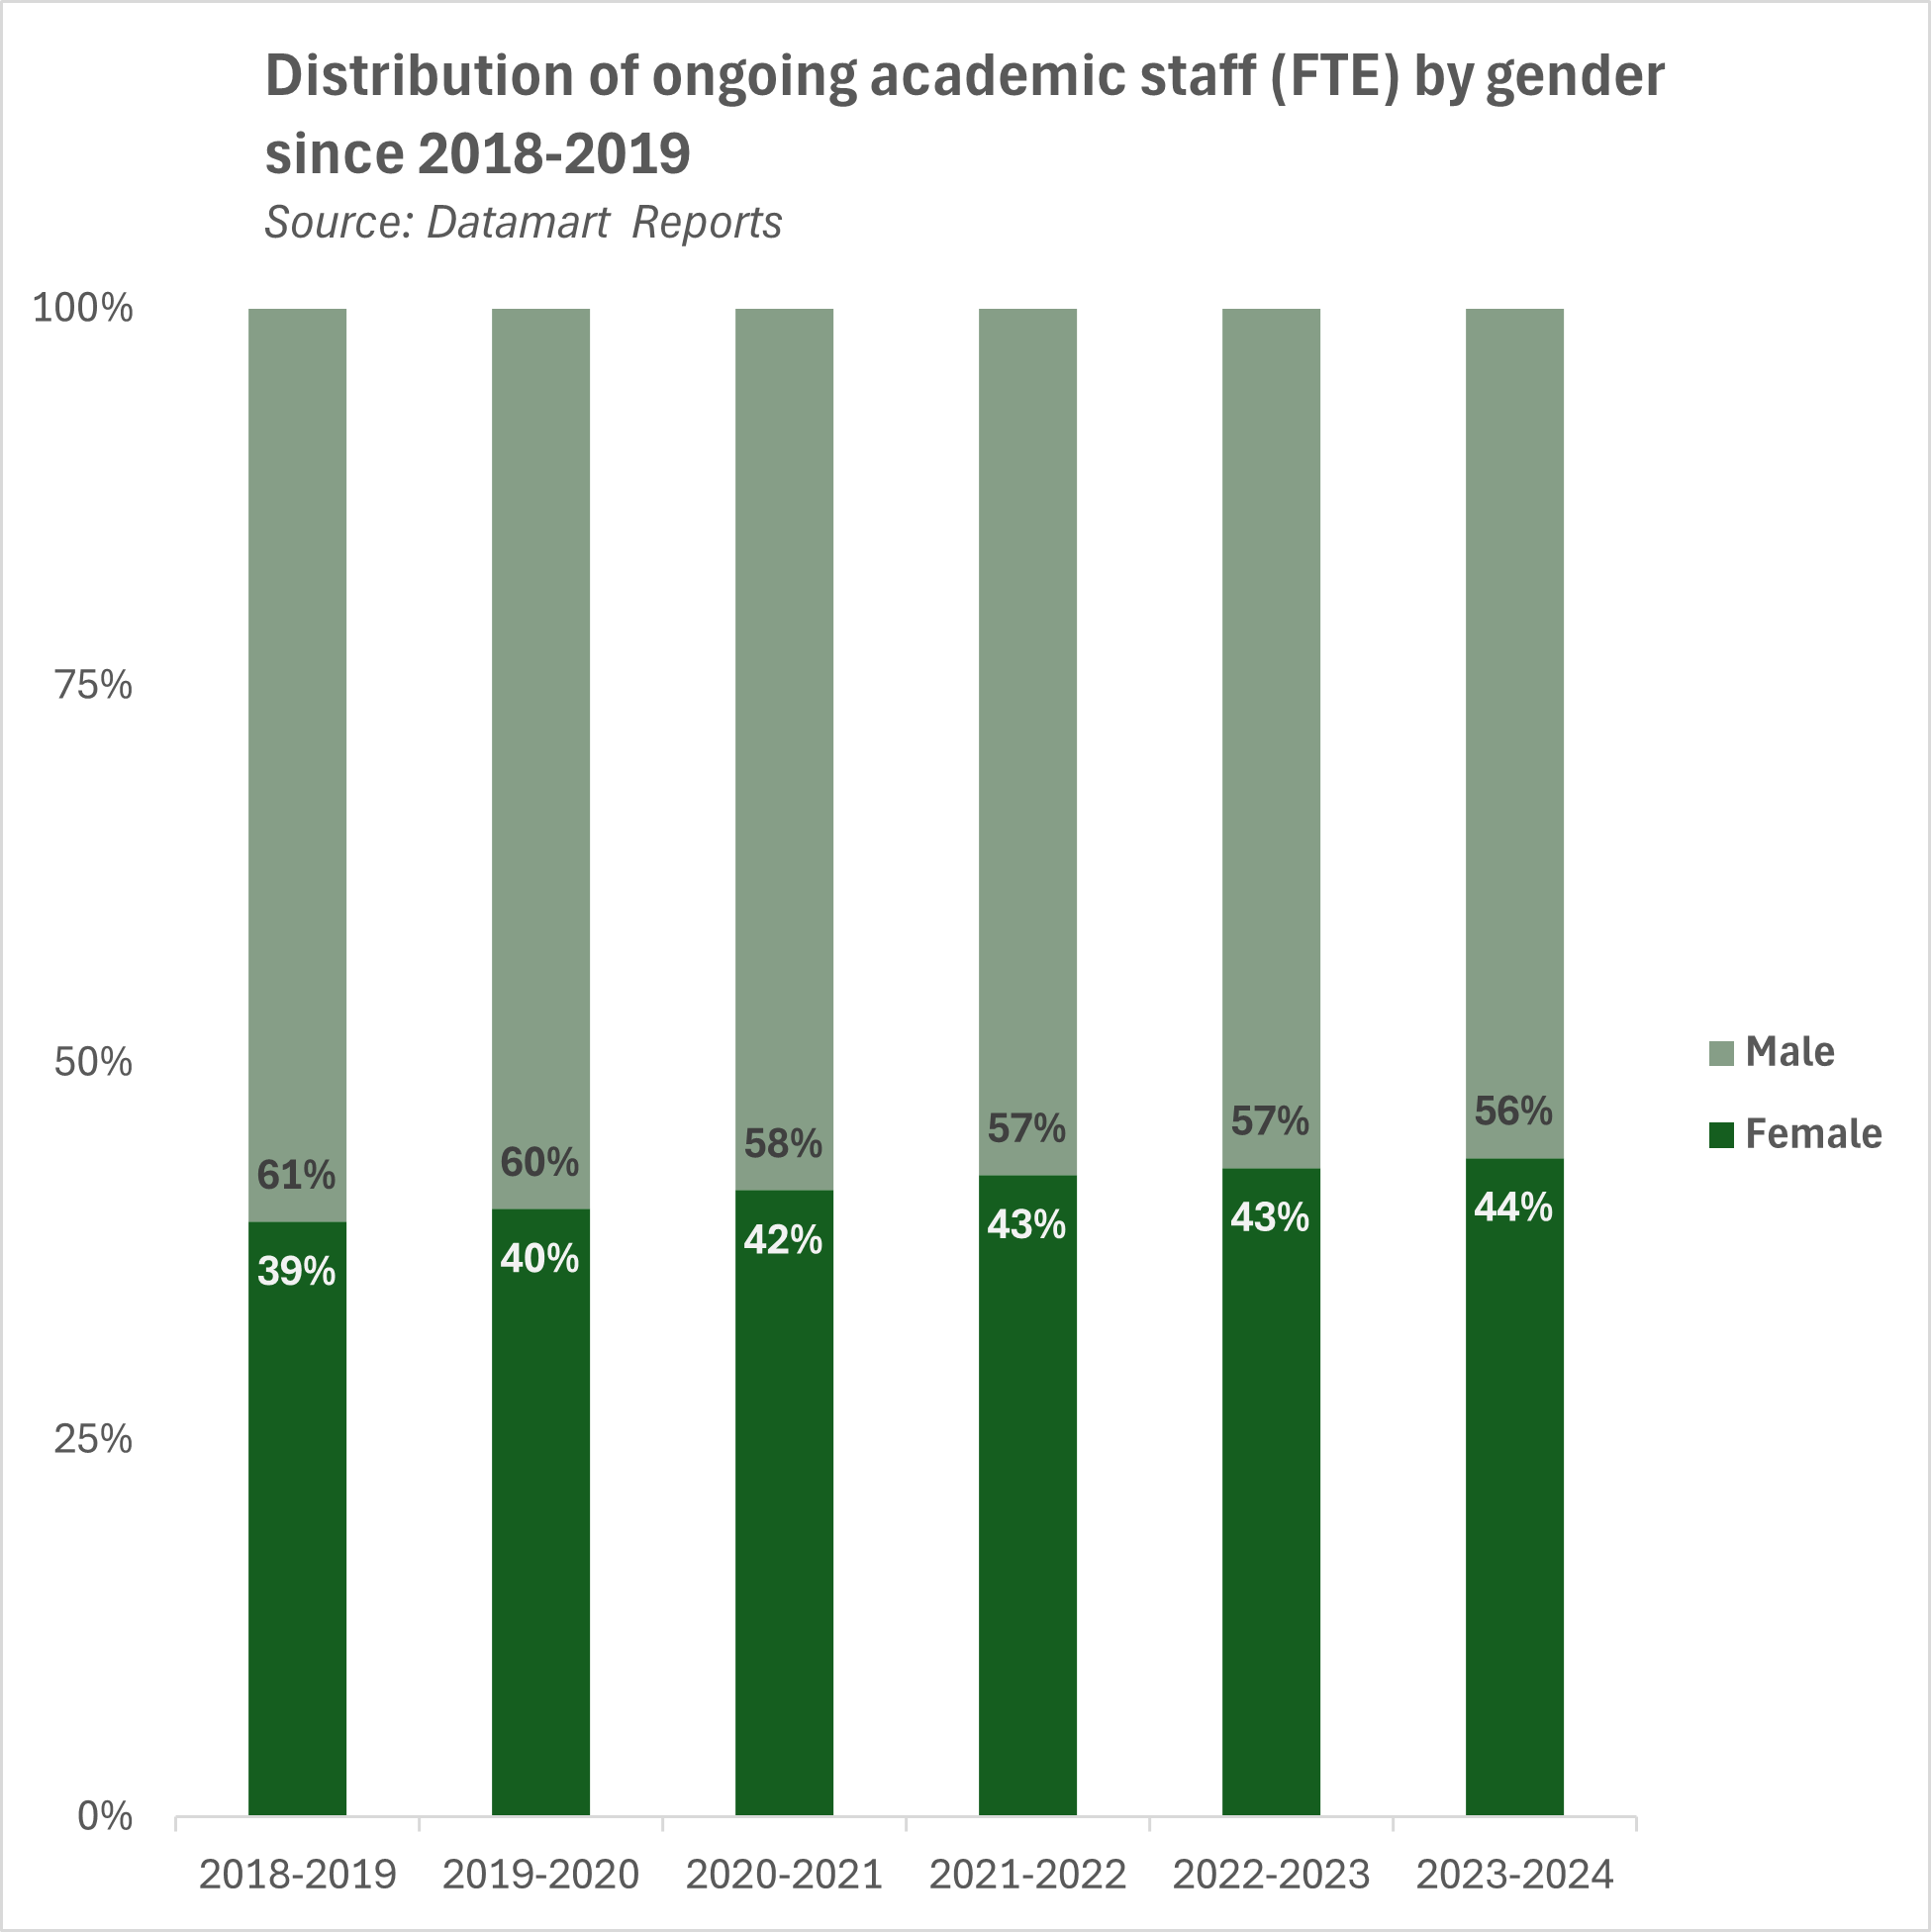
Most ongoing academic staff are men. However, the ratio of men and women is gradually approaching 50 per cent.
The gender ratio for ongoing academic staff varies among Faculties. More than 70 per cent of ongoing academic staff are women in LCR, Nursing, Social Work, and Werklund. Fewer than 30 per cent of ongoing academic staff in Haskayne, SAPL, and Schulich are women.
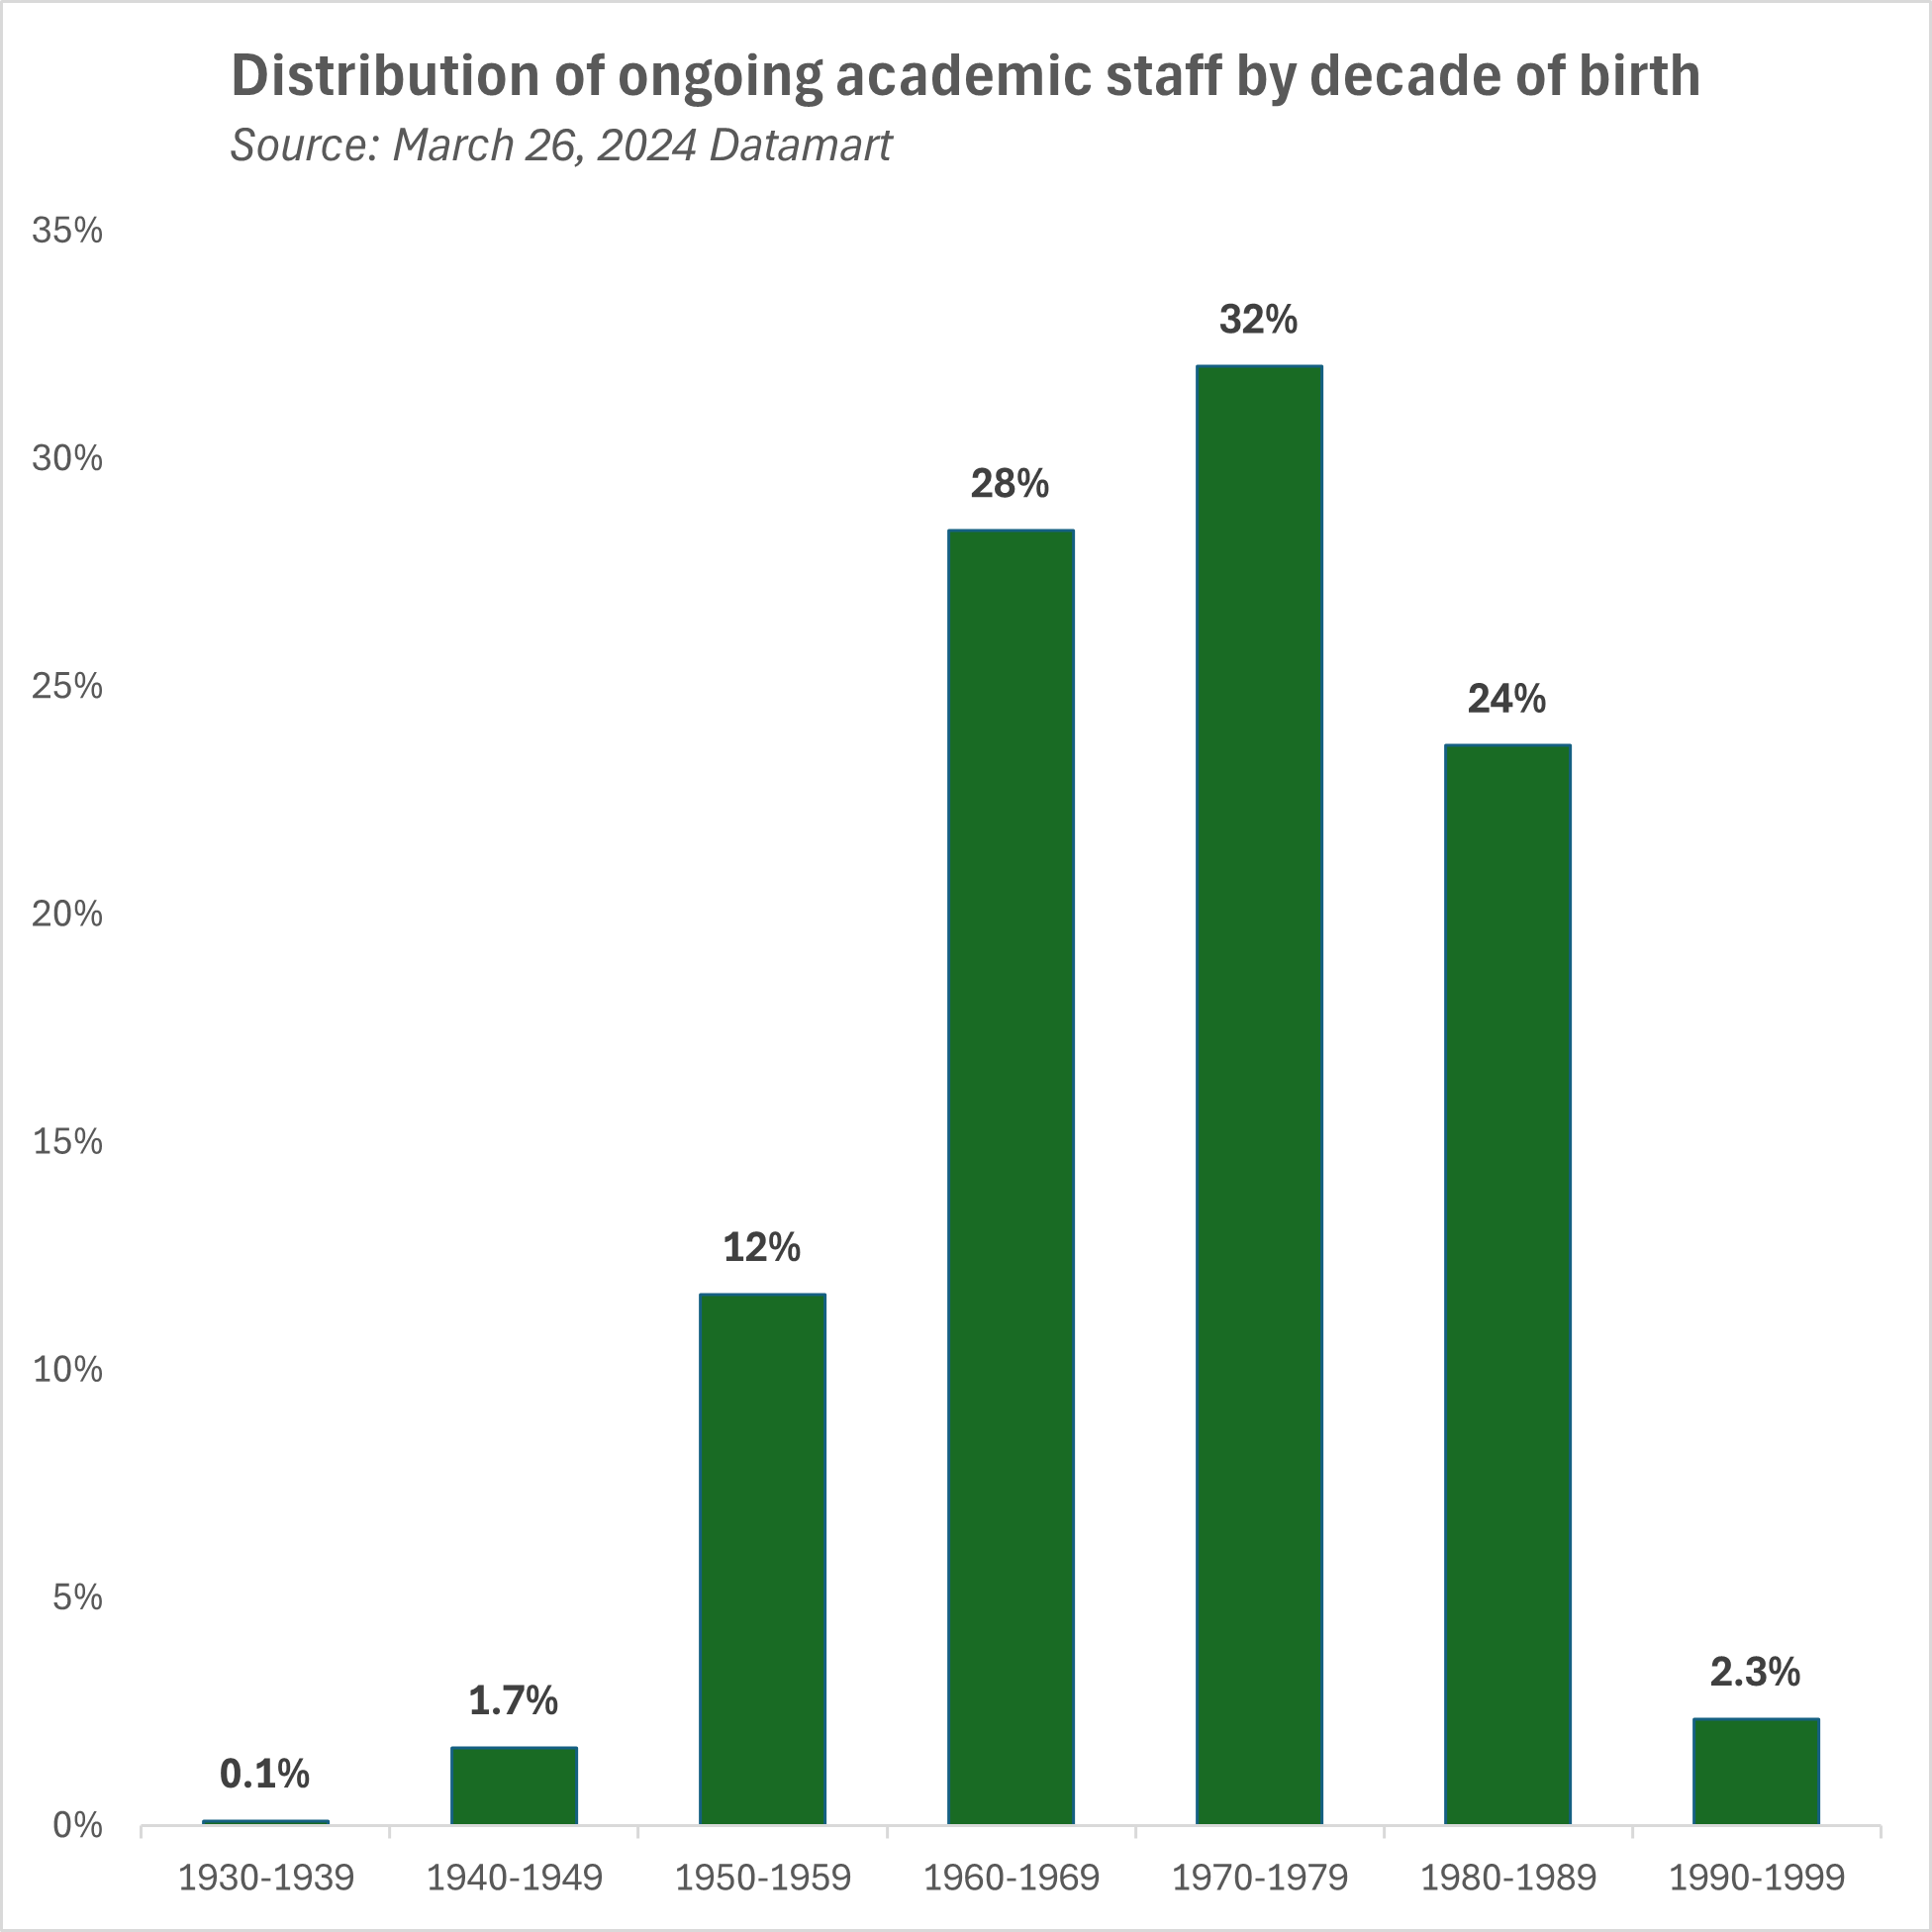
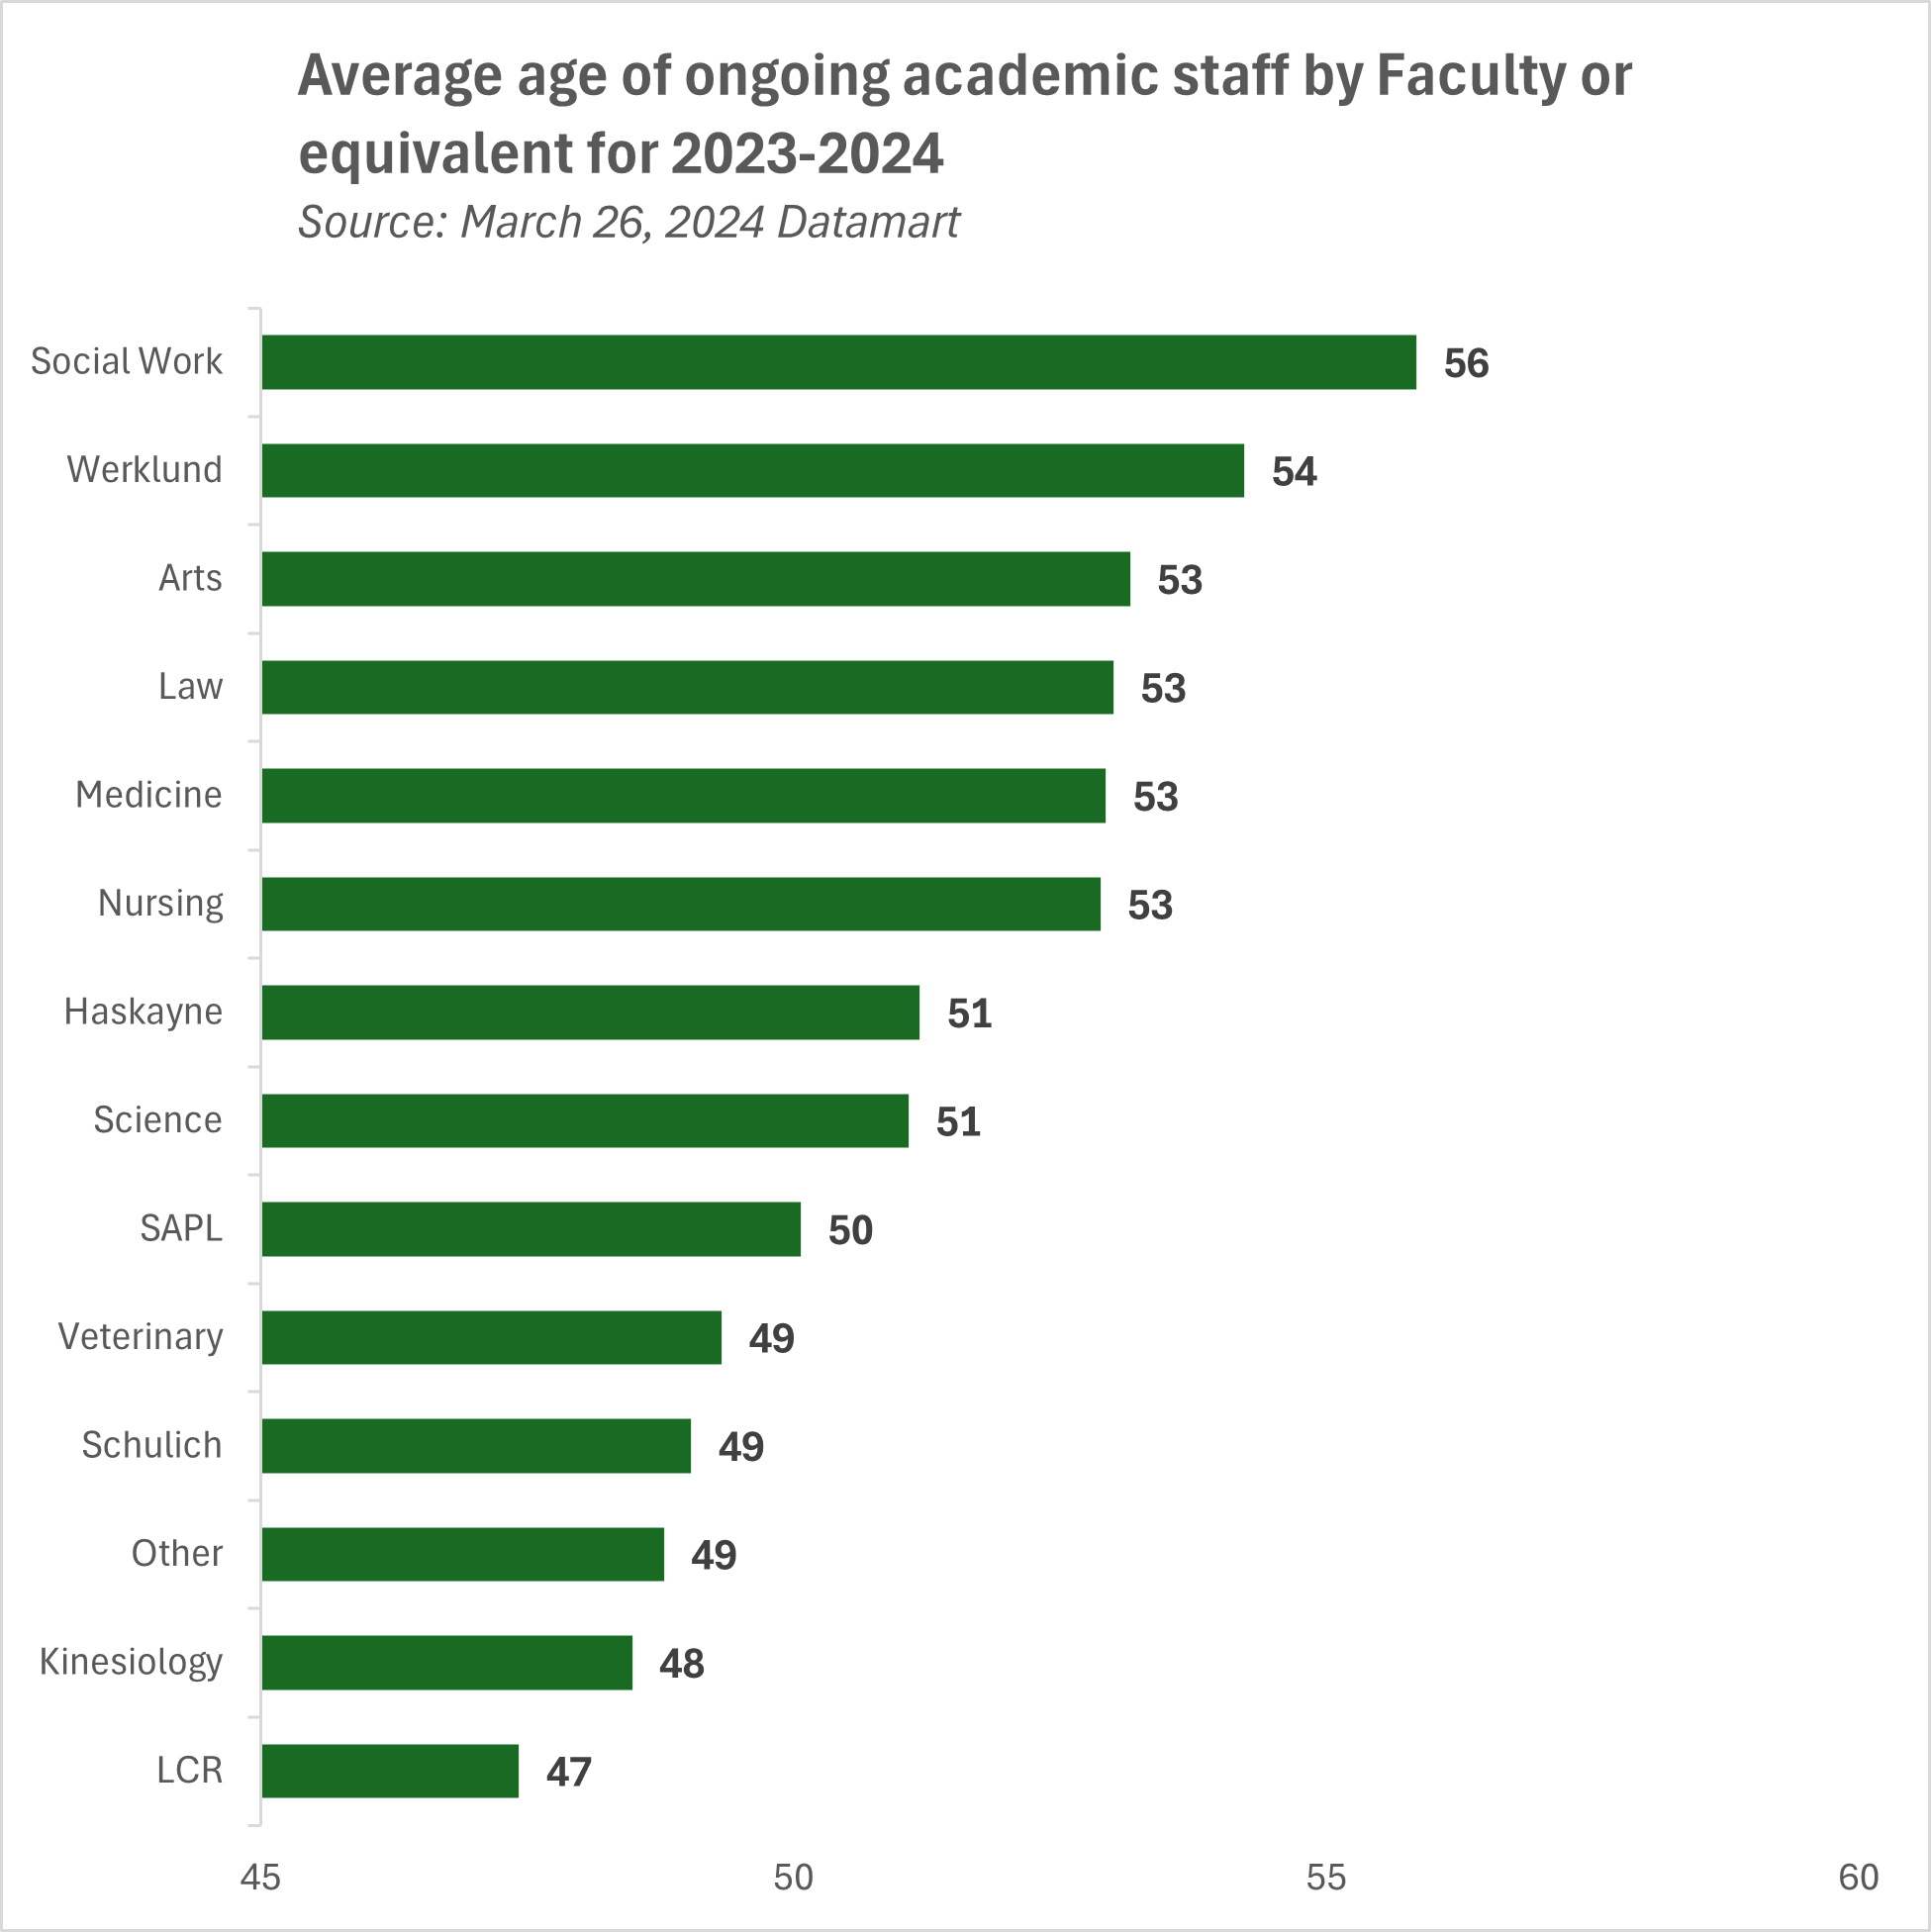
Distribution of ongoing academic staff by age
Nearly 60 per cent of ongoing academic staff were born after 1970 and more than 30 per cent were born between 1970 and 1979.
The average age of ongoing academic staff appears to vary among Faculties; ranging from 47 (SD = 10.4) in LCR to 56 (SD = 8.2) in Social Work.
Distribution of ongoing academic staff by stream and rank
Most of the professoriate are in the Teaching and Research stream (83 per cent). Full Professors in the Teaching and Research stream represent the largest group with 39 per cent of the professoriate. The Full Professors in the Teaching-Focussed stream are the smallest group with 2 per cent.
The relative number of academic staff in the Teaching-Focussed stream varies among Faculties. The Faculty of Nursing is the only Faculty where the Teaching-Focussed stream outnumber the Teaching and Research stream. The Cumming School of Medicine, the Faculty of Law and the Faculty of Kinesiology all have less than 10 per cent of the professoriate in the Teaching-Focussed stream.
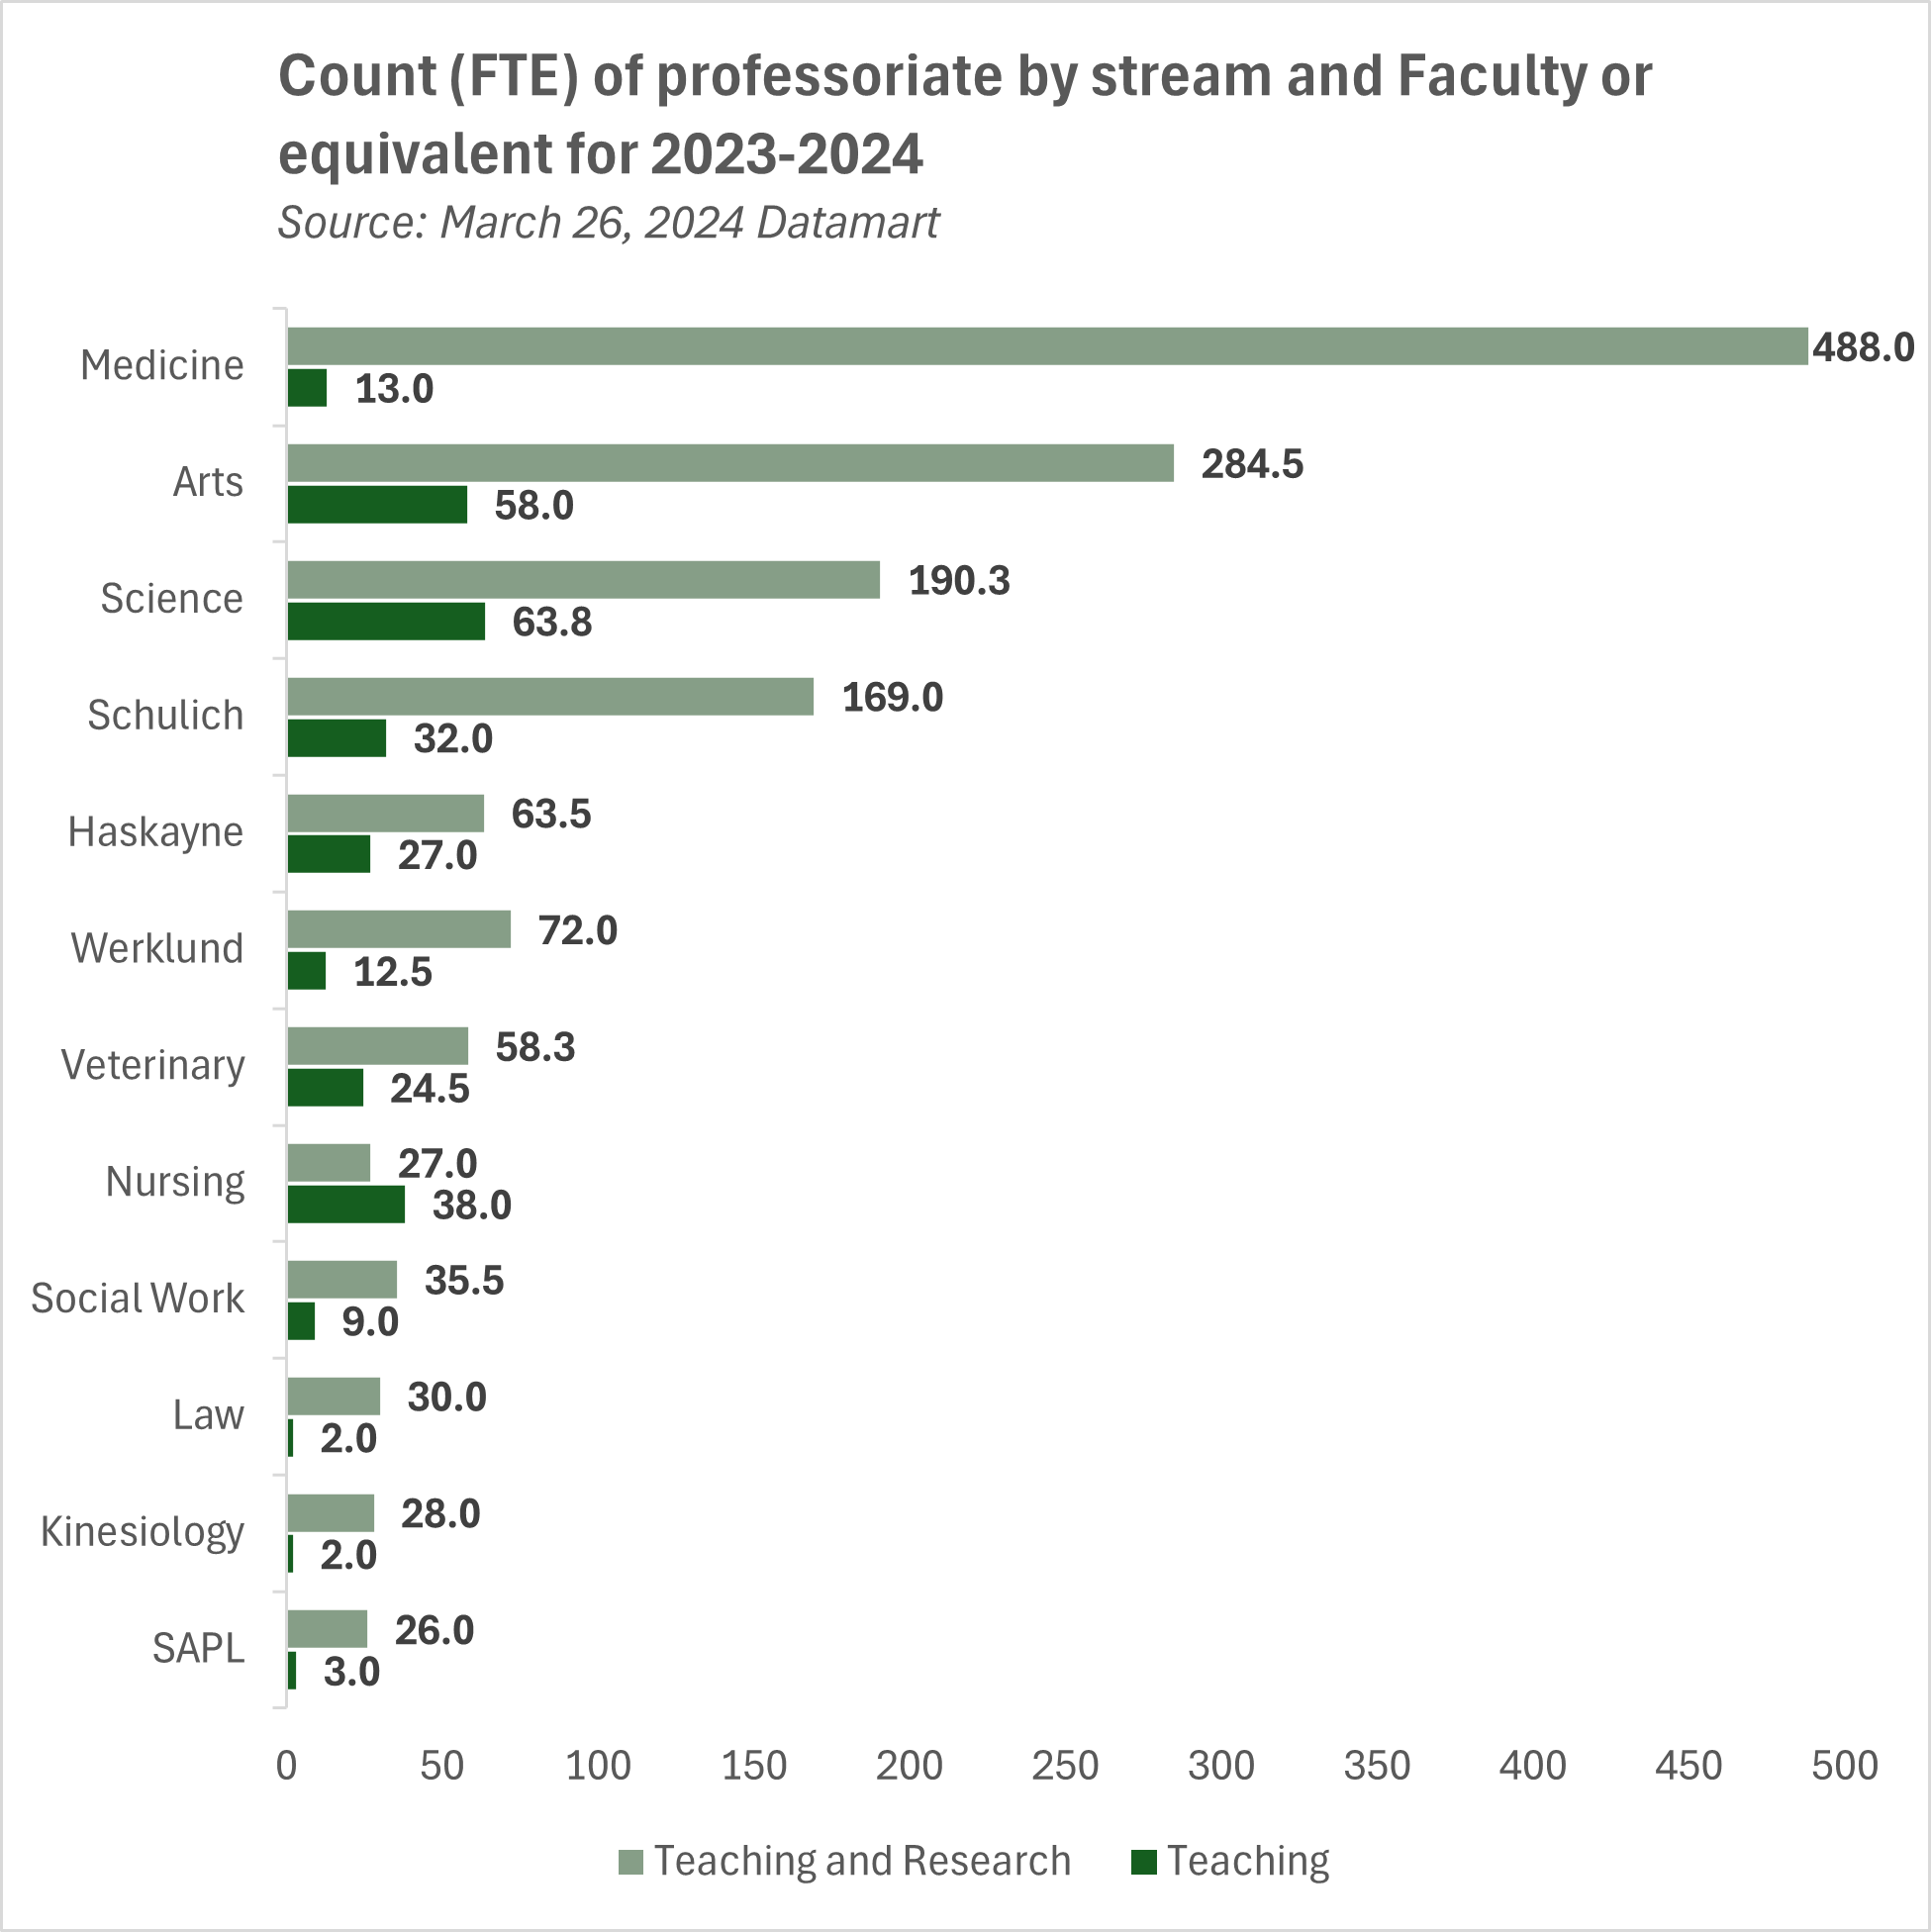
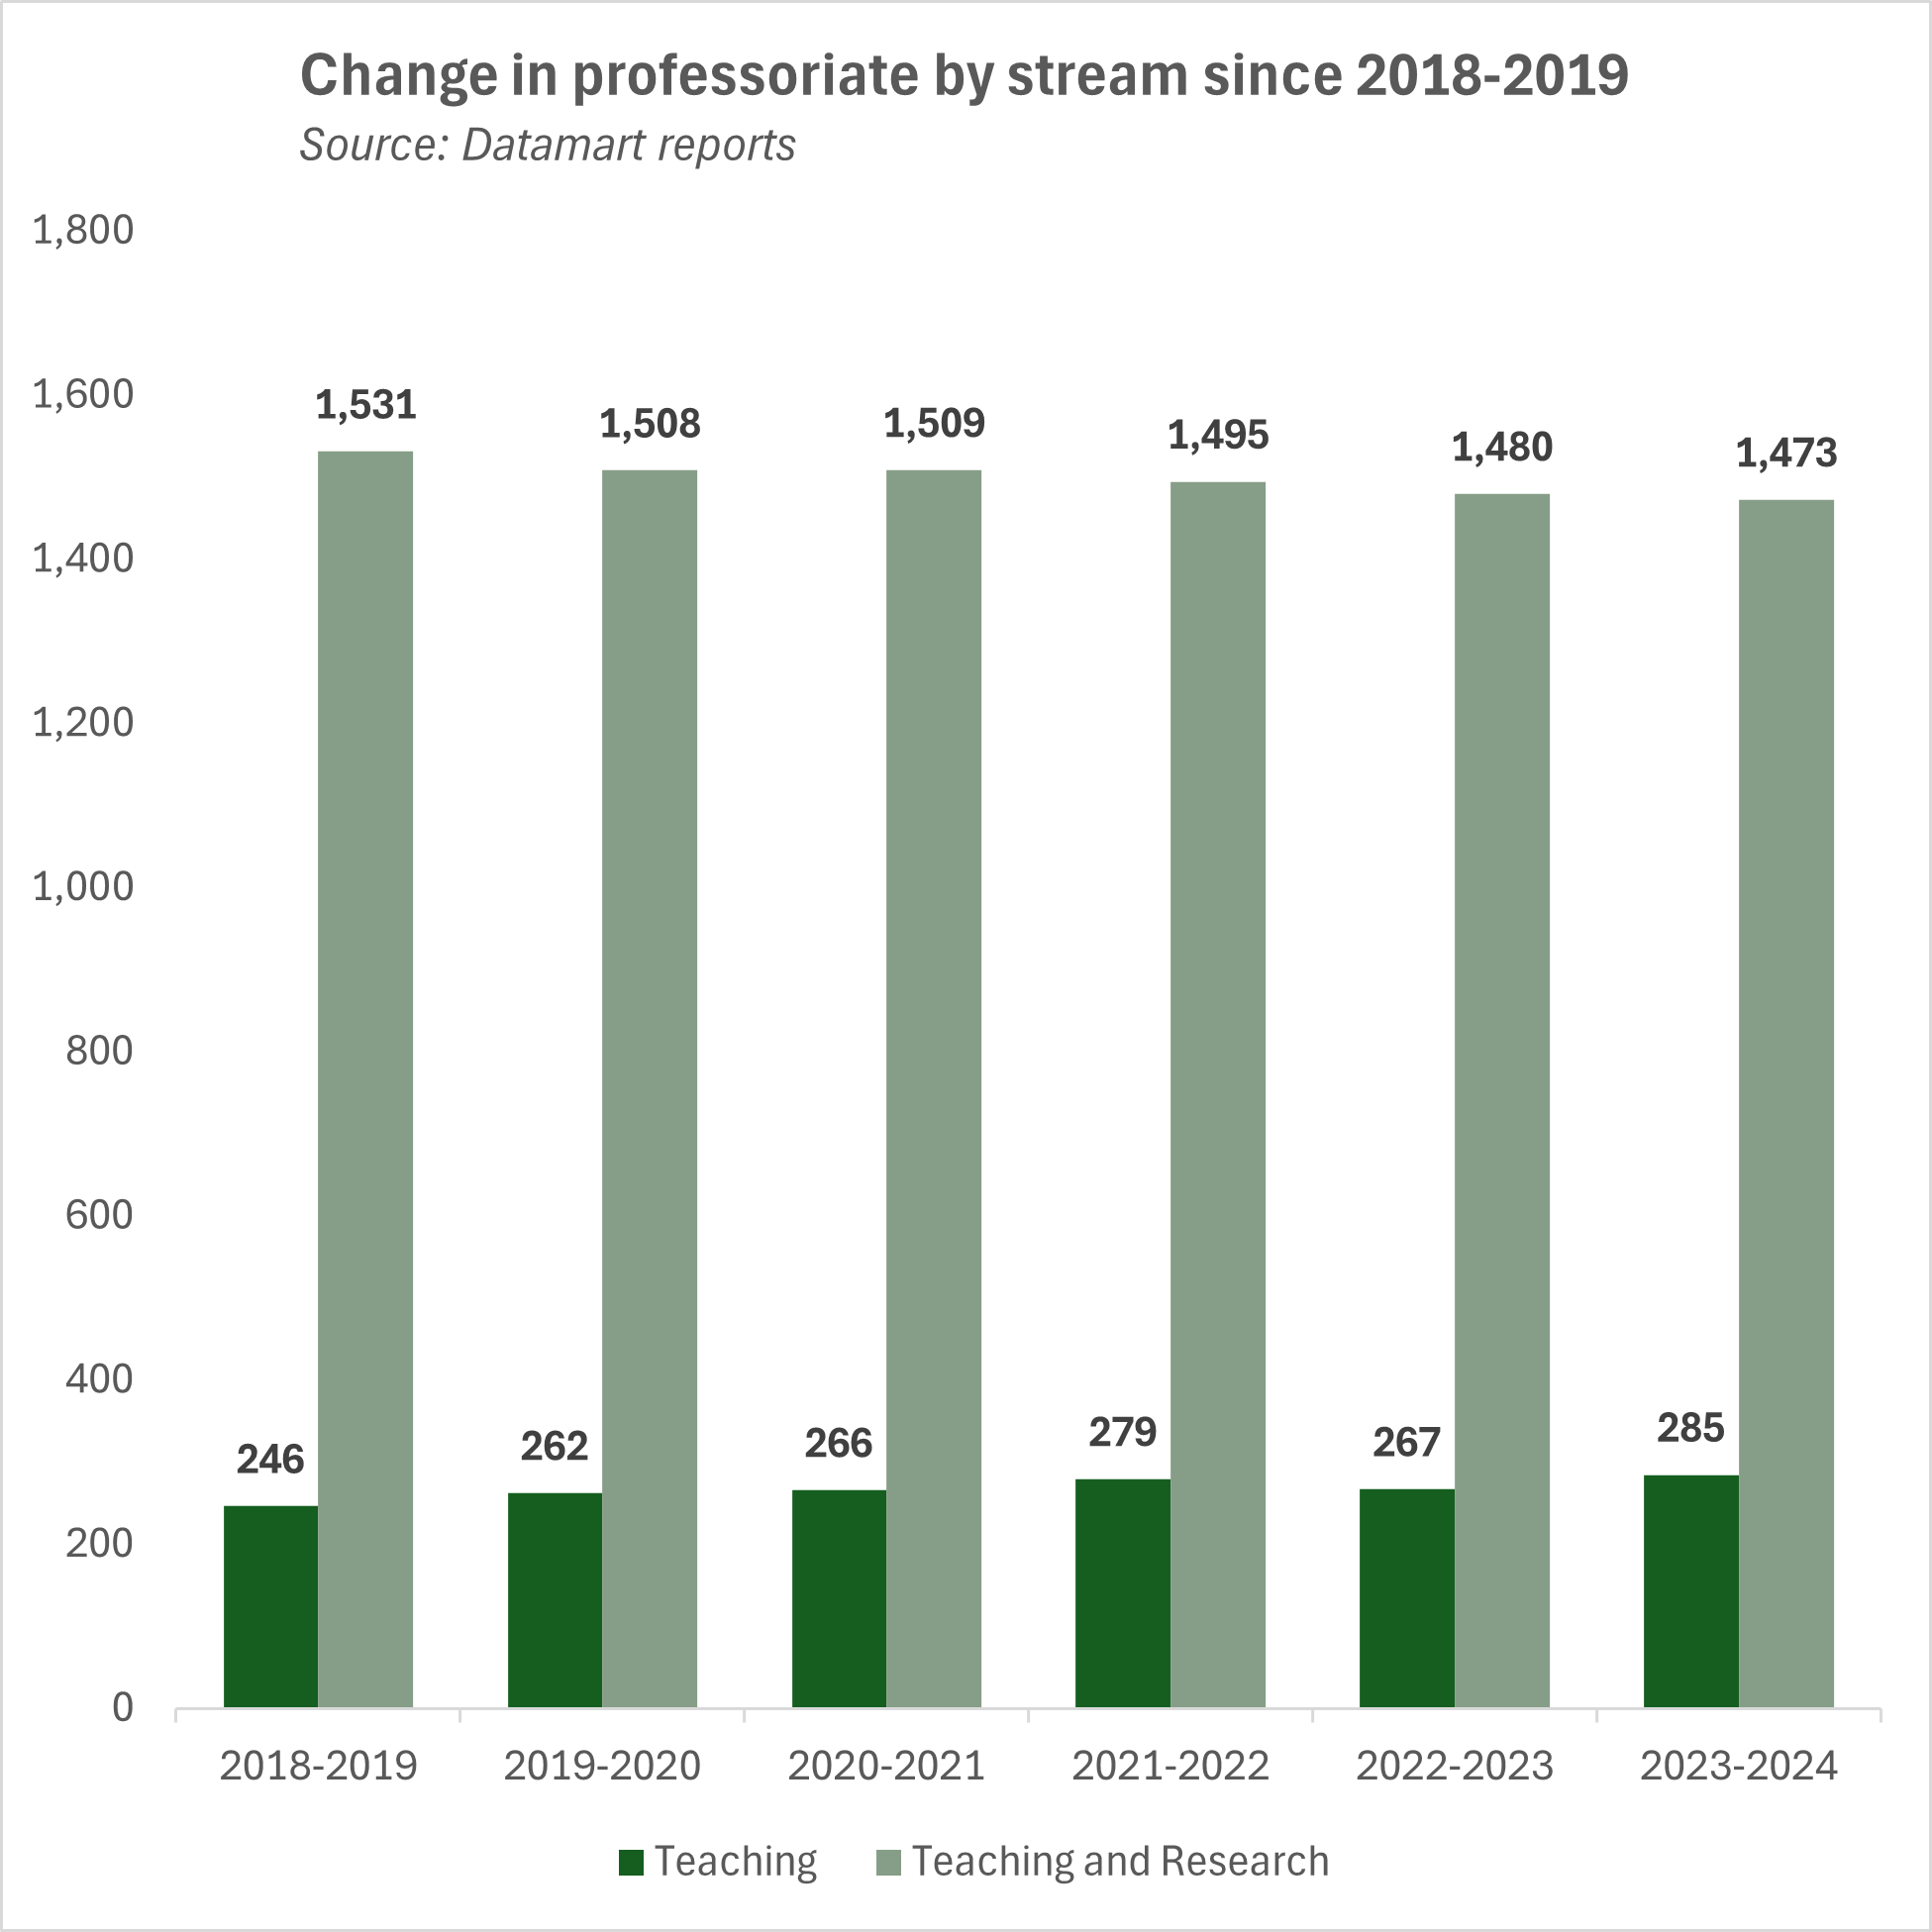
The total number of ongoing academic staff in the Teaching-Focussed stream has increased from 246 to 285 since 2018-2019 while the total number in the Teaching and Research stream has decreased from 1,531 to 1,473.
Librarians are the largest segment with about 80 per cent of all ongoing academic staff in the archivists, curators, and librarians job categories. Most ongoing librarians are in the Associate (41 per cent) and Full Librarian ranks (39 per cent).
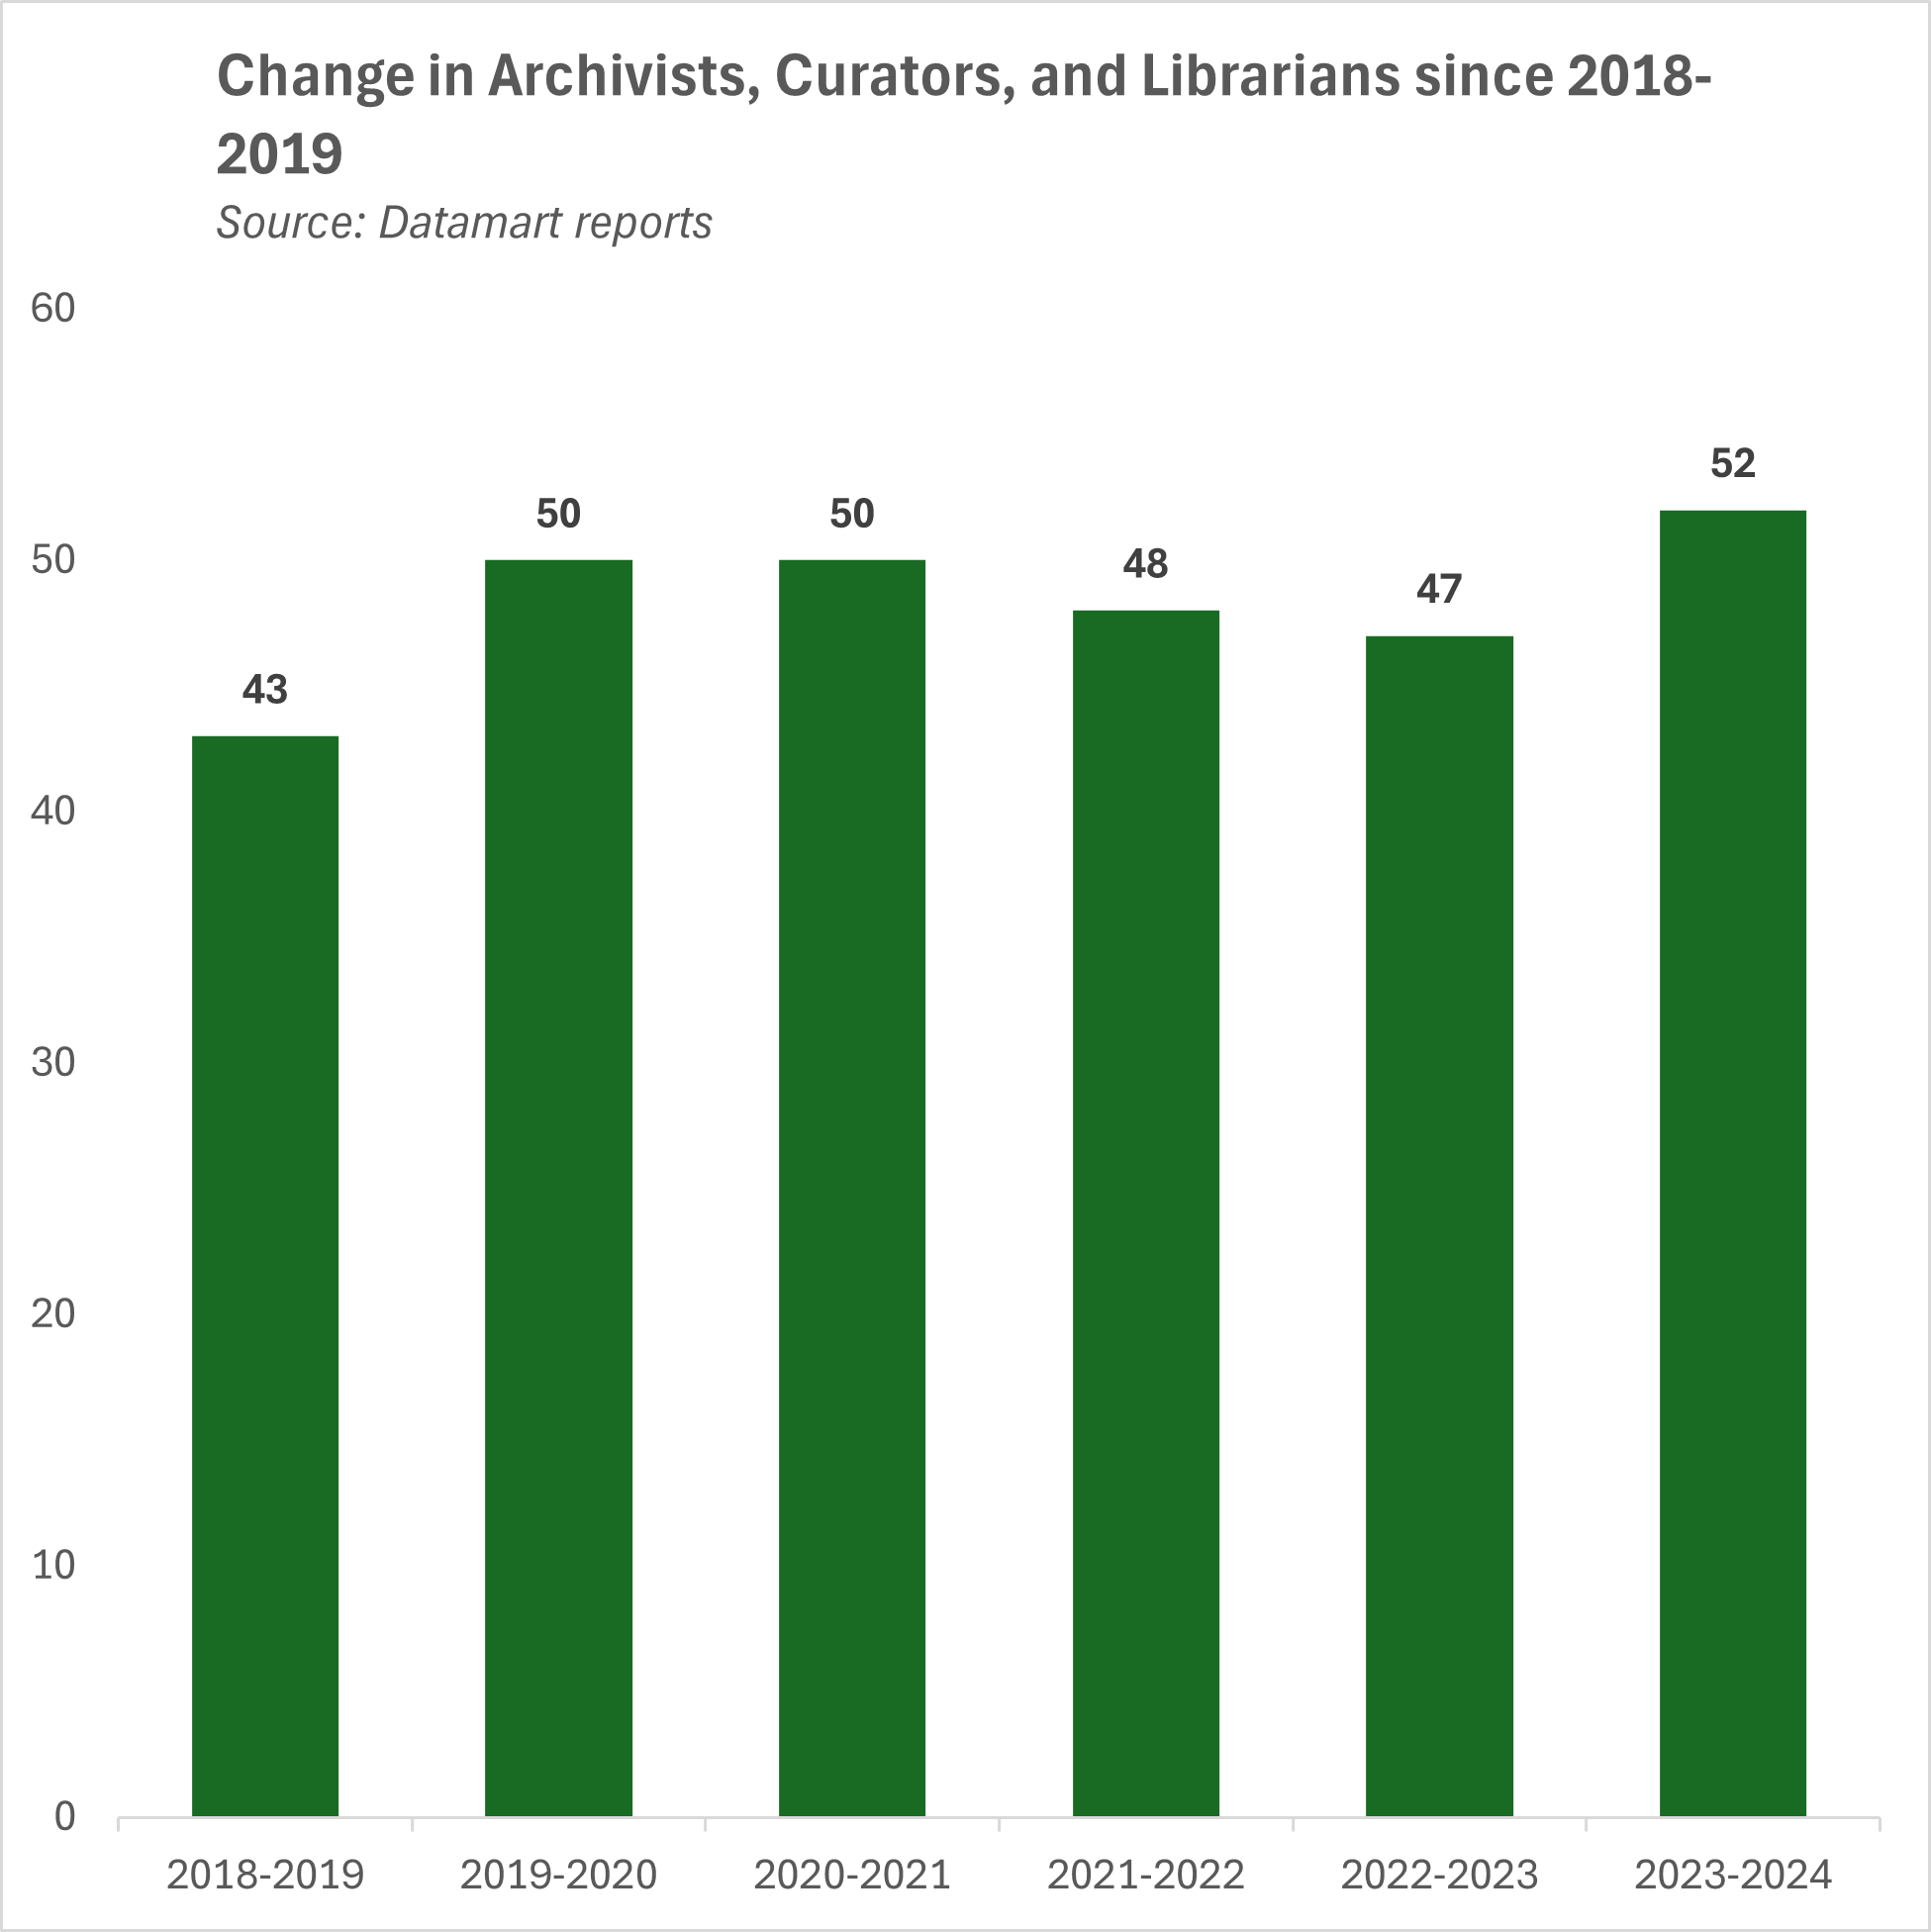
The total number of archivists, curators, and librarians has increased from 43 in 2018-2019 to 52 in 2023-2024.
3.
2024 Statistical Summary of Ongoing Academic Staff